文章阅读目录大纲
目前经过改进和优化之后的基于mzkit代码库底层的msimaging质谱成像软件包在样本可视化上进行了非常多的改进,诸如:
- 添加样本原始背景叠加
目前进行质谱成像可视化,程序包不仅仅可以使用任意rgb纯色来作为可视化的背景。目前还可以支持直接使用原始数据的背景作为质谱成像的显示背景。进行这个显示的秘诀就在于简单的在脚本中添加一个TIC背景图层:geom_MSIbackground("TIC")

ggplot(msi_data, padding = "padding: 200px 600px 200px 250px;")
+ geom_MSIbackground("TIC")
# rendering of a single ion m/z
# default color palette is Jet color set
+ geom_msimaging(mz = mz, tolerance = "da:0.01")
+ geom_MSIfilters([
"knn_fill(3,0.65,random=false)"
"soften()"
"power(2)"
])
+ MSI_hqx(1)
# add ggplot charting elements
+ ggtitle(`MSImaging of m/z ${mz}`)
+ labs(x = "Dimension(X)", y = "Dimension(Y)")
+ scale_x_continuous(labels = "F0")
+ scale_y_continuous(labels = "F0")
;- 可视化滤镜
可能从上面的示例代码中,大家也可以看见了,有一个名字叫做geom_MSIfilters
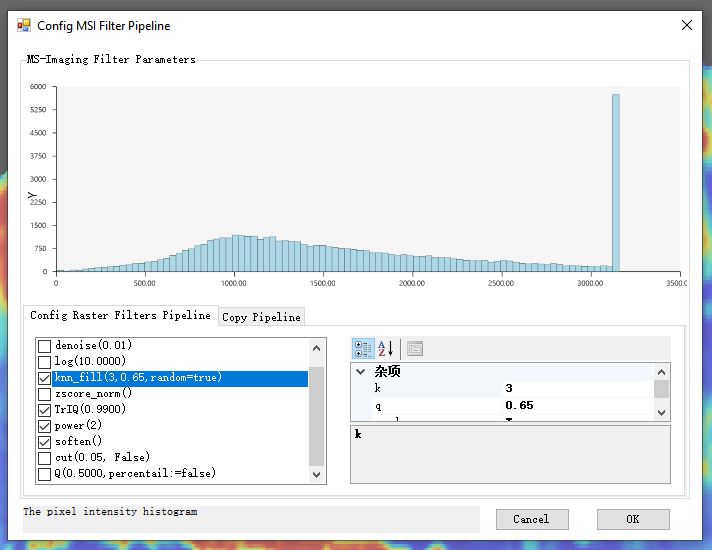
首先,我们在打开了软件界面之后,完成原始数据的加载。然后再主界面上,通过【Tweaks MSI Filters】菜单打开滤镜配置窗口。在这里我们可以调整目前整个流程支持的一些图像信号数据处理的滤镜参数。完成调整后,可以切换至【Copy Pipeline】标签页进行滤镜参数的复制,然后将复制的滤镜参数信息粘贴到我们所编写的ggplot成像可视化脚本中,作为geom_MSIfilters
| 滤镜参数配置 | 复制滤镜参数 |
|---|---|
 |
 |
- 显示样本区域轮廓
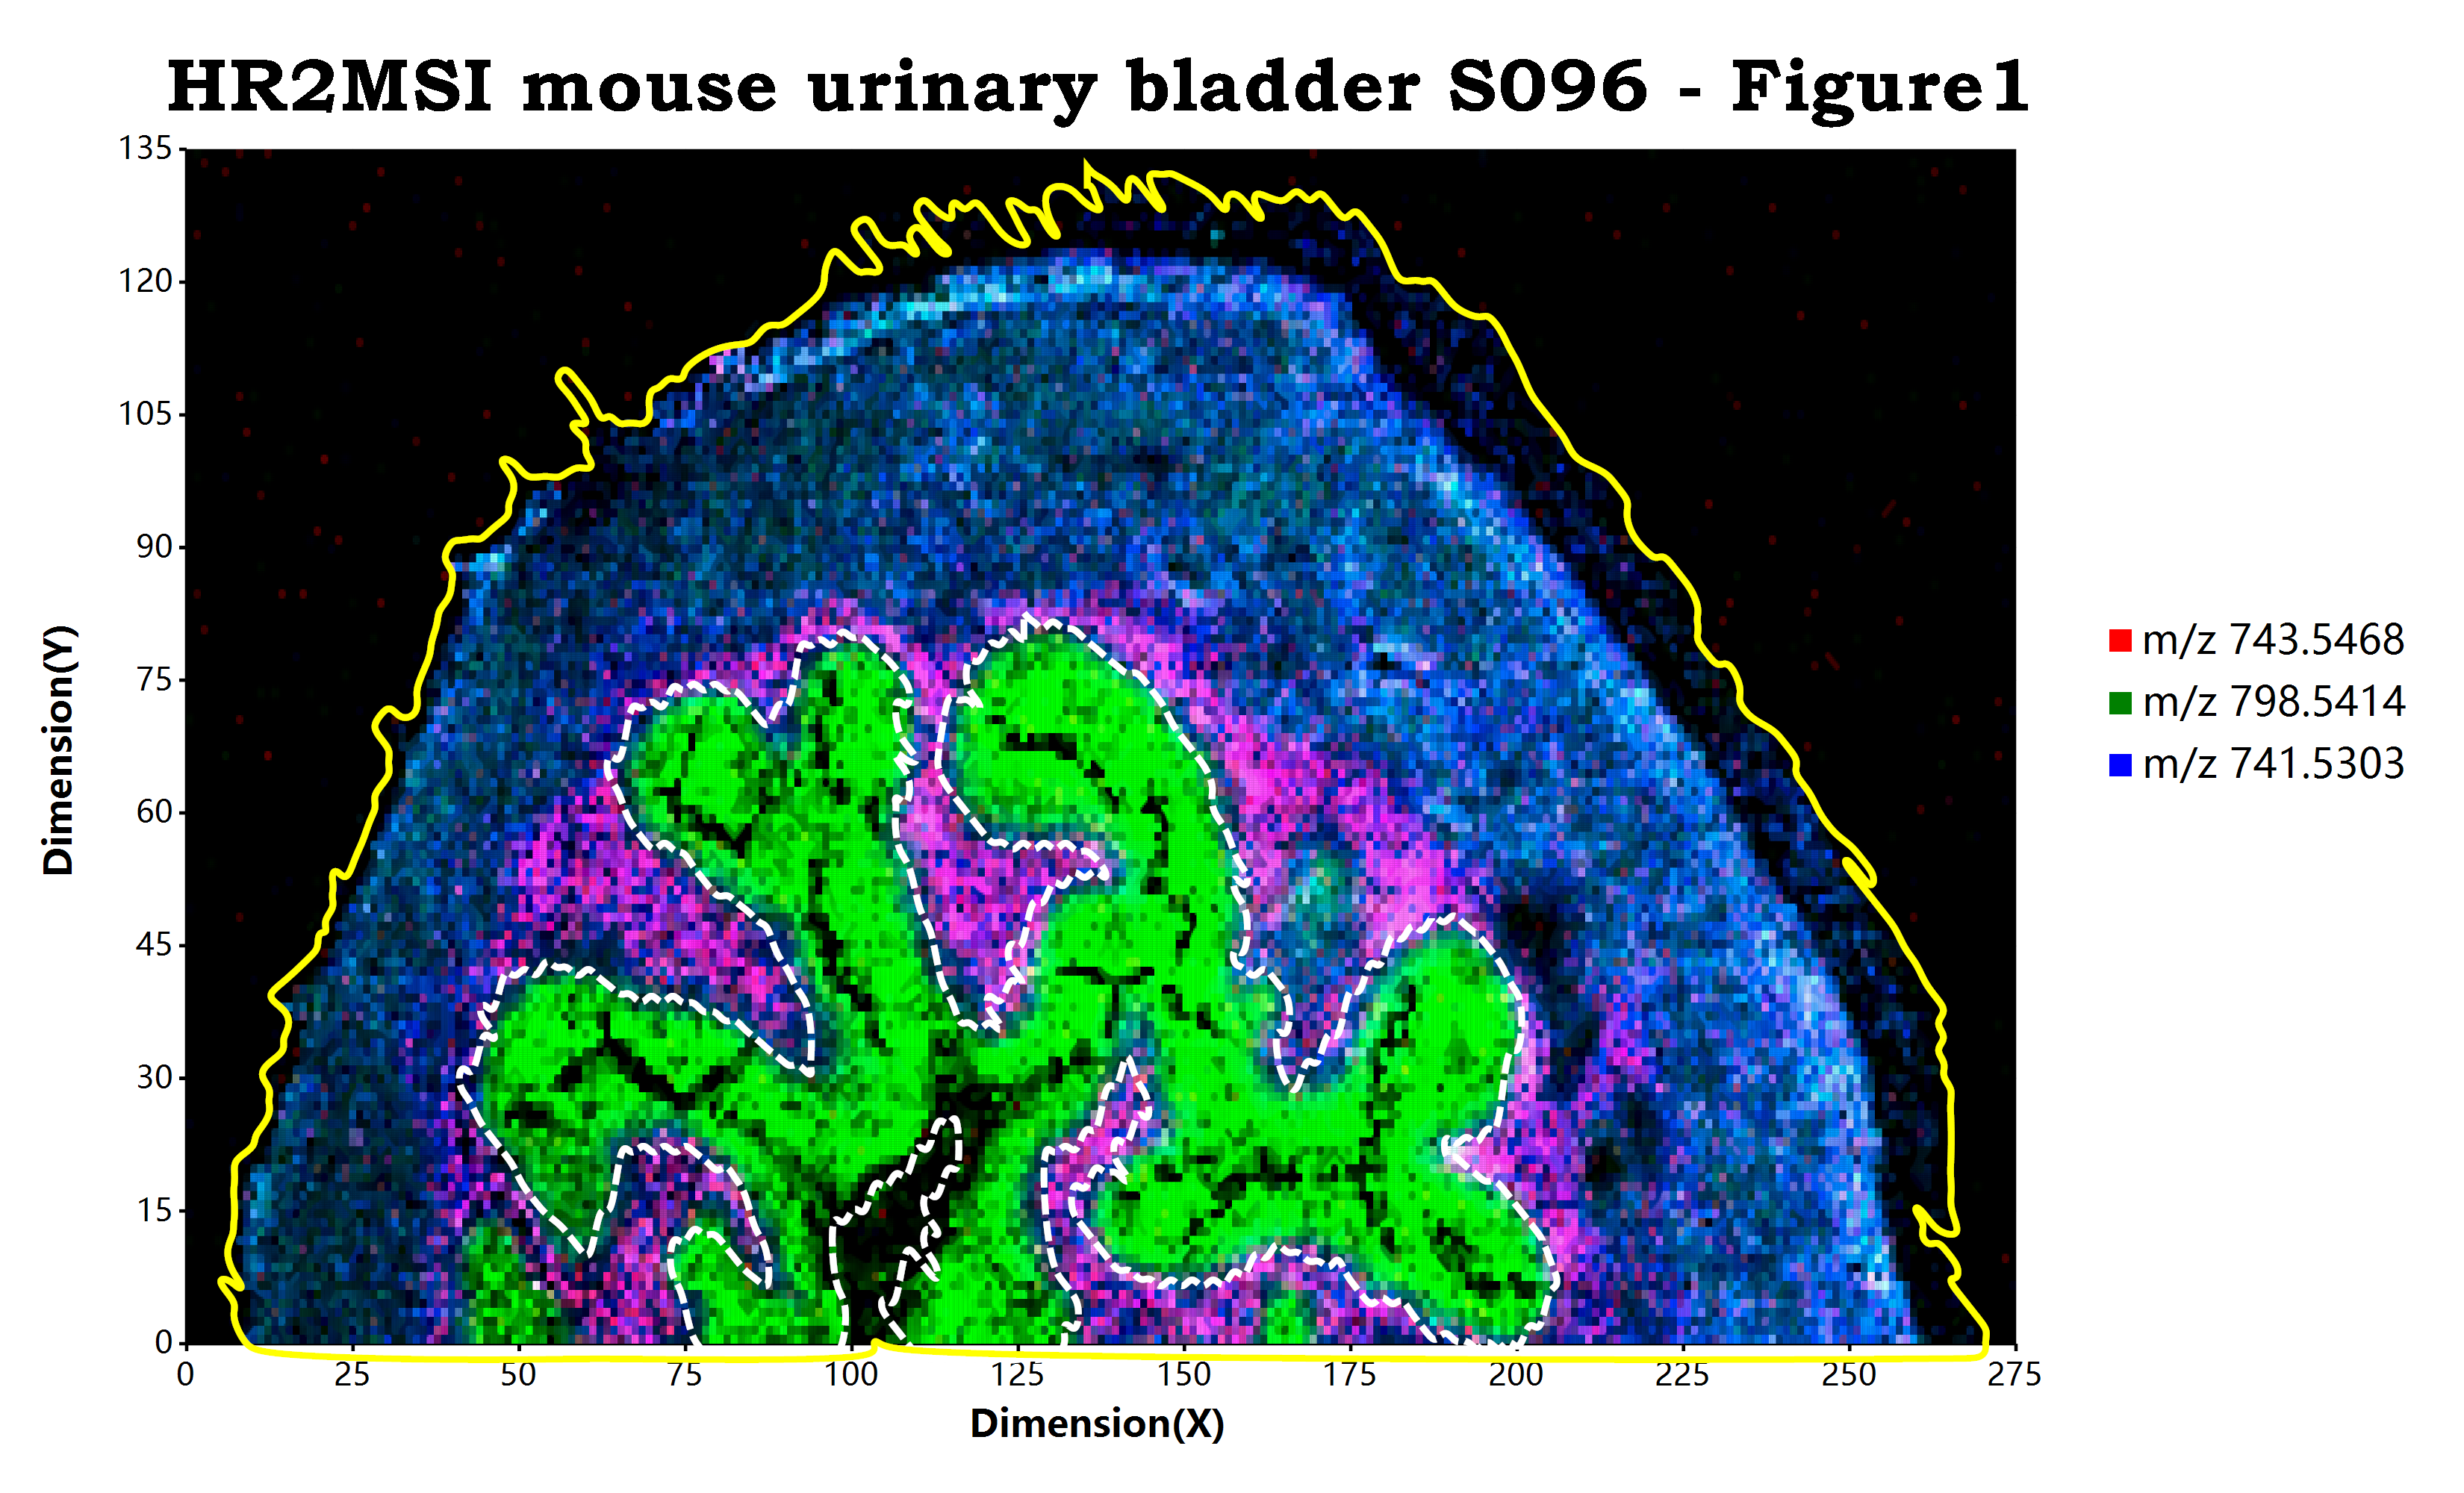
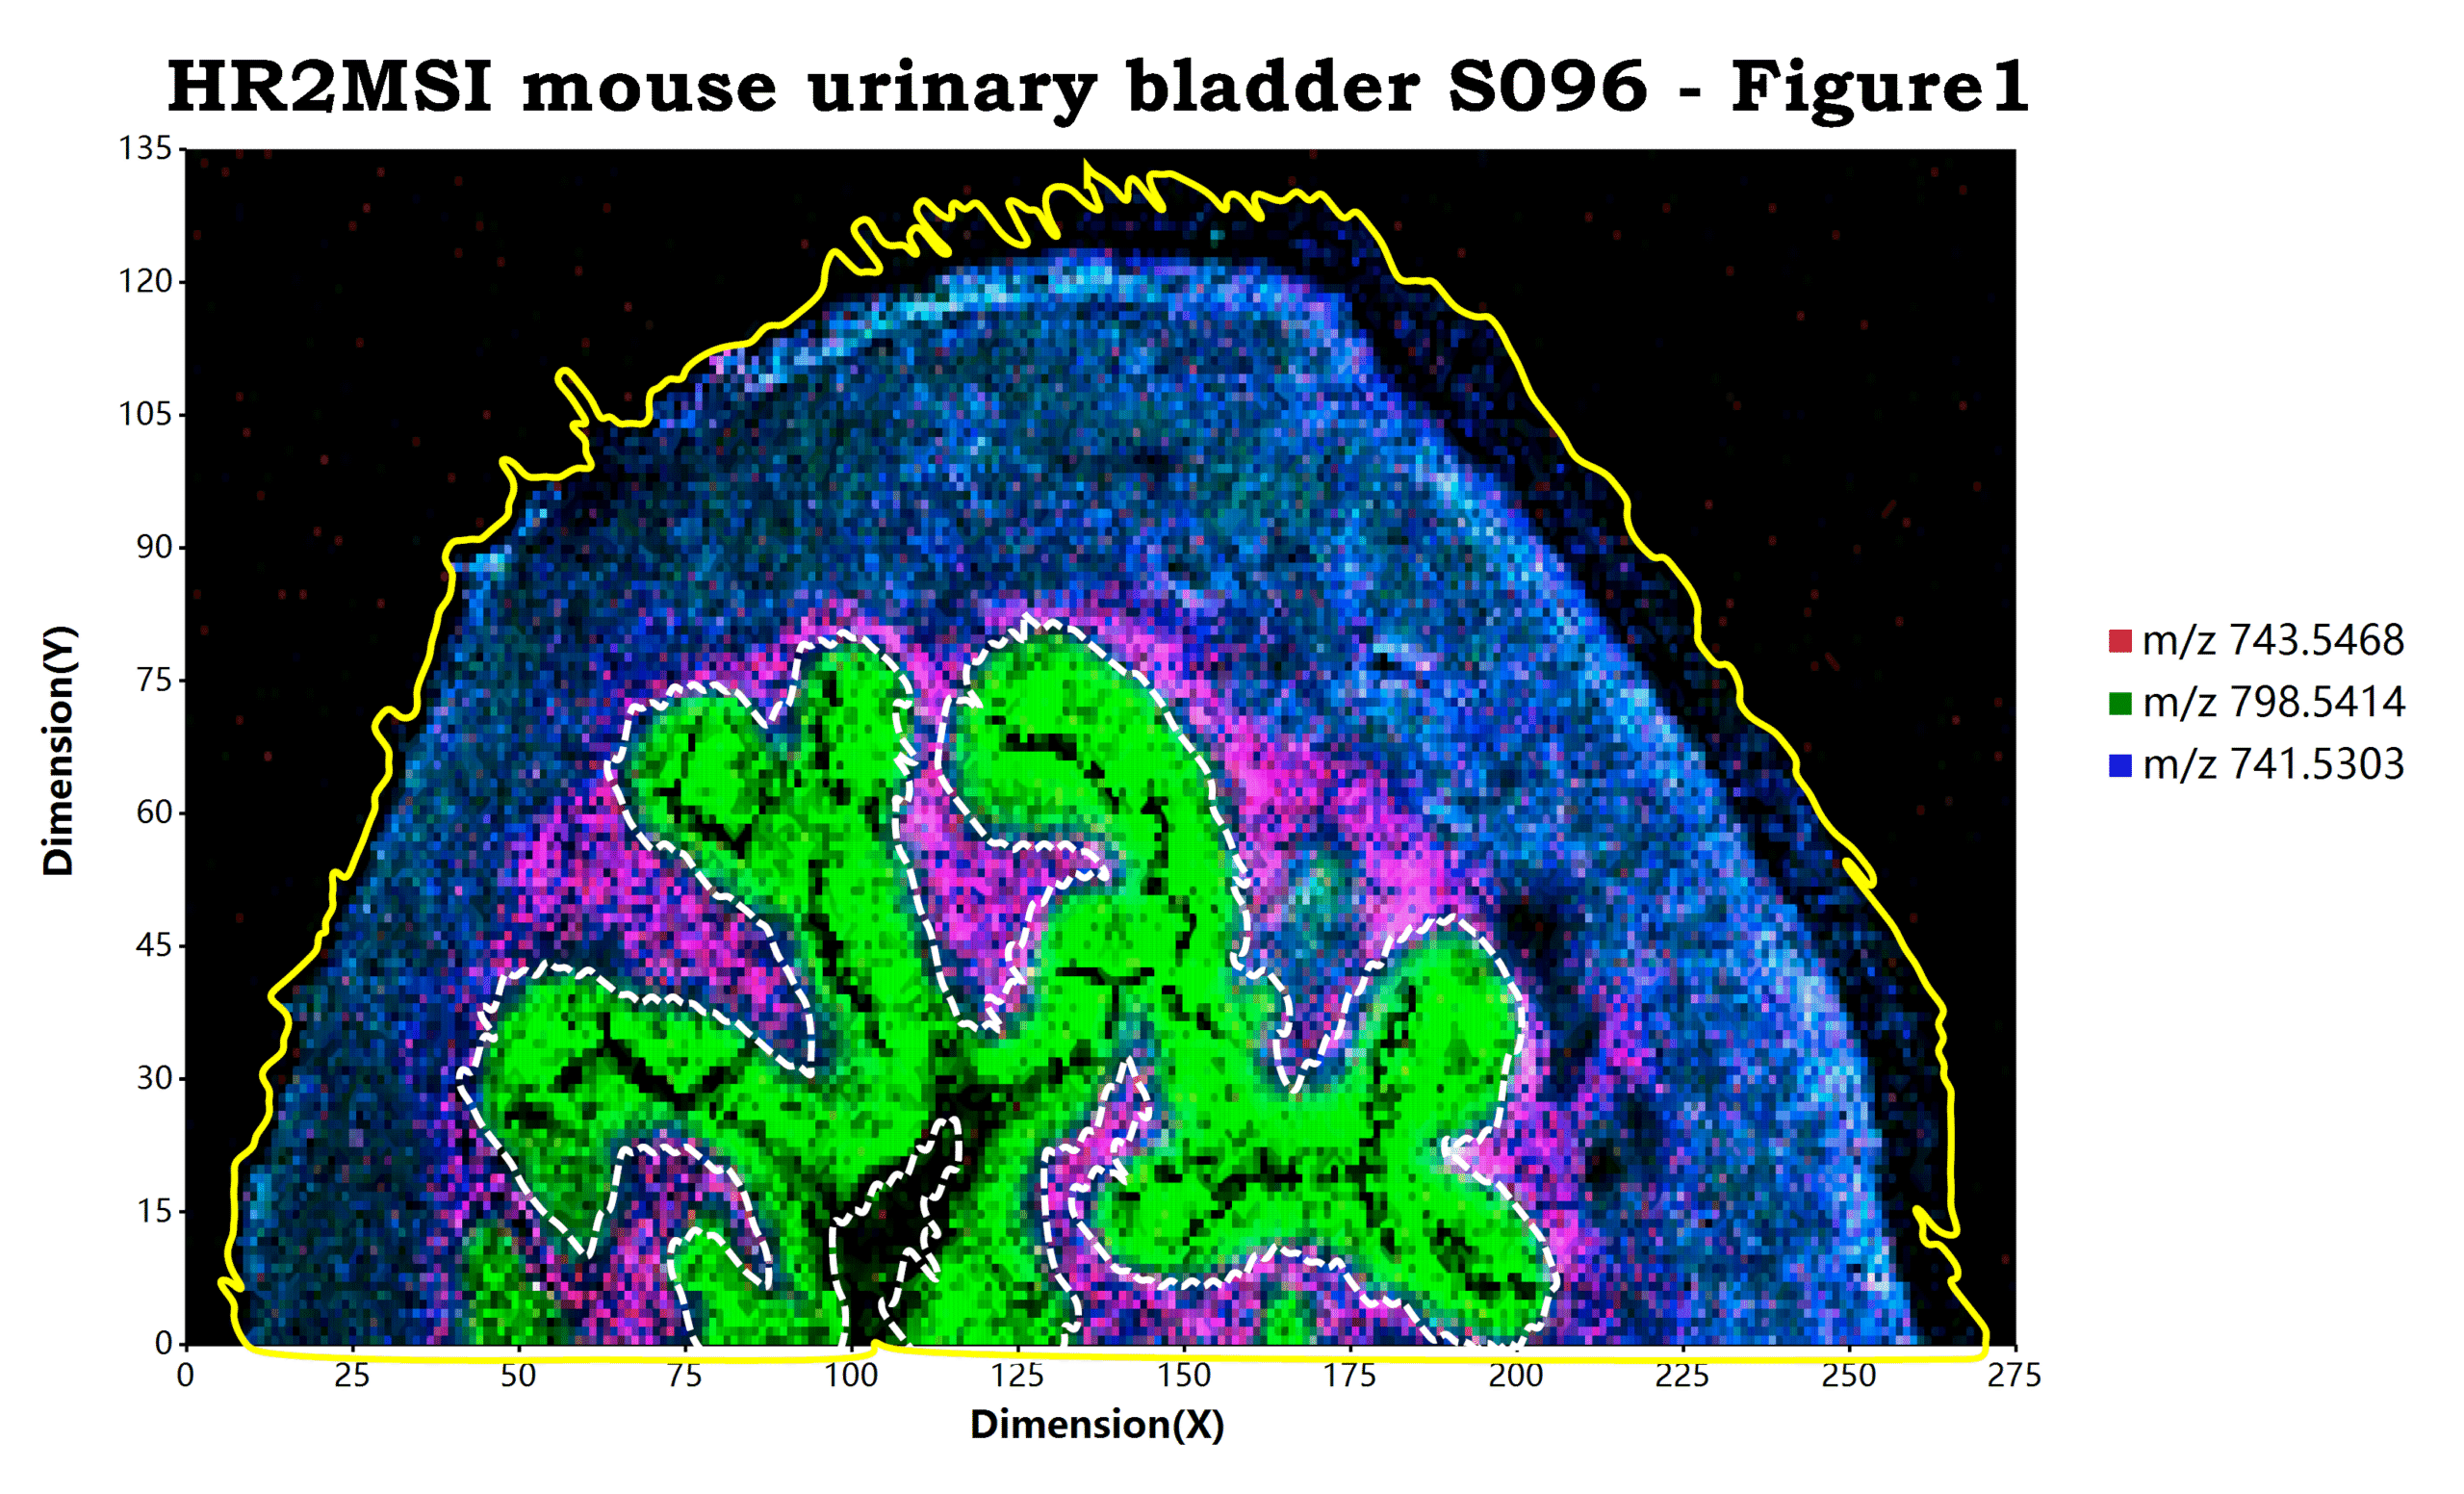
最后一个更新的我认为是比较好的一个辅助功能,就是通过算法计算出一个给定的样本区域的轮廓信息并显示出来。在这里我们可以简单的通过添加geom_sample_outline

# load mzpack/imzML raw data file
# and config ggplot data source driver
# as MSImaging data reader
ggplot(open.mzpack(msi_rawdata),
       padding = "padding: 200px 600px 200px 250px;"
)
   # rendering of rgb channels ion m/z
   + geom_red(mz = 743.5468, tolerance = "da:0.3")
   + geom_green(mz = 798.5414, tolerance = "da:0.3")
   + geom_blue(mz = 741.5303, tolerance = "da:0.3")
   + theme(panel.background = "black", panel.grid = element_blank())
   + geom_MSIfilters(
        TrIQ_scale(0.999)
   )
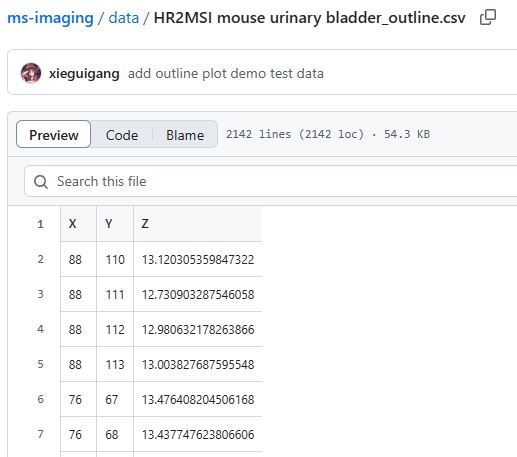
   + geom_sample_outline(spots = region_spots,
        threshold = 0,
        scale = 5,
        degree = 20,
        resolution = 1000,
        q = 0.1,
        line_stroke = "stroke: white; stroke-width: 9px; stroke-dash: dash;")
   + geom_sample_outline(
        threshold = 0,
        scale = 5,
        degree = 20,
        resolution = 1000,
        q = 0.1,
        line_stroke = "stroke: yellow; stroke-width: 9px; stroke-dash: solid;")
   # add ggplot charting elements
   + ggtitle("HR2MSI mouse urinary bladder S096 - Figure1")
   + labs(x = "Dimension(X)", y = "Dimension(Y)")
   + scale_x_continuous(labels = "F0")
   + scale_y_continuous(labels = "F0")
;使用方法就如同上面的示例代码显示的一样,我们可以再完成了可视化成像的图层构建之后,追加geom_sample_outline

例如在上面的示例代码之中,
- 第一个
geom_sample_outline函数通过spots参数传入了一个数据框,并且使用line_stroke设置了区域轮廓的显示样式为使用白色的虚线显示那个特定区域的轮廓。 - 而第二个
geom_sample_outline函数则没有传递任何参数信息给spots参数,设置的line_stroke样式为黄色的实线,这意味着脚本将会使用原始数据的坐标点信息进行整个样本轮廓的计算和显示,使用黄色实线来显示出整个样本的轮廓。
实现算法原理
上面所展示的样本或者组织区域轮廓的展示,都是通过Marching Squares算法中的Contour Tracing方法来实现的。Marching Squares算法和Contour Tracing(轮廓追踪)是计算机图形学和图像处理中用于提取物体边界的两种密切关联的技术。在之前的工作尝试中,分别基于这里提到的算法进行了二维区域的标记以及数据等高线的计算。关于算法的详细实现细节,可以阅读之前的两篇文章:
a. 【图像处理】基于Contour Tracing 方法获取多边形轮廓
b. 绘制等高线图
在之前已经实现的算法代码基础上,我们在这里针对之前所实现的轮廓计算算法进行了msimaging成像软件包的集成。现在我们来详细的了解我们在这里是如何实现geom_sample_outline这个函数的。
首先,我们定义了一个ggplot图层对象来存储函数的参数输入:
Public Class MSISampleOutline : Inherits ggplotLayer

    Public Property contour_scale As Integer = 5
    Public Property degree As Single = 20
    Public Property resolution As Integer = 1000
    Public Property q As Double = 0.1
    Public Property line_stroke As Stroke
    Public Property threshold As Double = 0

    ''' <summary>
    ''' the region spot data
    ''' </summary>
    ''' <returns></returns>
    Public Property spots As Point()
    ''' <summary>
    ''' a pre-computed cache data
    ''' </summary>
    ''' <returns></returns>
    Public Property precomputed As GeneralPath

End Class
基于上面所申明的样本轮廓类,我们就可以存储下来函数的参数数据:
<ExportAPI("geom_sample_outline")>
<RApiReturn(GetType(MSISampleOutline))>
Public Function geom_sample_outline(<RRawVectorArgument>
                                    Optional region As Object = Nothing,
                                    Optional threshold As Double = 0,
                                    Optional scale As Integer = 5,
                                    Optional degree As Single = 20,
                                    Optional resolution As Integer = 1000,
                                    Optional q As Double = 0.1,
                                    Optional line_stroke As Object = "stroke: white; stroke-width: 6px; stroke-dash: solid;",
                                    Optional env As Environment = Nothing) As Object

    Dim line As Stroke = ggplotExtensions.GetStroke(line_stroke, "stroke: white; stroke-width: 6px; stroke-dash: solid;")
    Dim outline As New MSISampleOutline With {
        .line_stroke = line,
        .contour_scale = scale,
        .degree = degree,
        .q = q,
        .resolution = resolution
    }

    If Not region Is Nothing Then
        If TypeOf region Is dataframe Then
            Dim df As dataframe = region
            Dim x As Integer() = CLRVector.asInteger(df.getBySynonym("x", "X"))
            Dim y As Integer() = CLRVector.asInteger(df.getBySynonym("y", "Y"))

            outline.spots = x _
                .Select(Function(xi, i) New Point(xi, y(i))) _
                .ToArray
        ElseIf TypeOf region Is GeneralPath Then
            ' is pre-computed graphics path
            ' use this path for region shape drawing directly
            outline.precomputed = DirectCast(region, GeneralPath)
        Else
            Return Message.InCompatibleType(GetType(GeneralPath), region.GetType, env)
        End If
    End If

    Return outline
End Function在拥有了计算所需要的数据之后,我们就可以调用MSIRegionPlot.MeasureRegionPolygon来进行轮廓的计算。
Dim shape As GeneralPath = ContourLayer.GetOutline(x, y, scale)

If degree > 0 AndAlso resolution > 0 Then
    shape = shape.Bspline(degree, resolution)
    shape = shape.FilterSmallPolygon(q)
End If在这个轮廓计算过程中,我们通过Contour Tracing先大致的计算出一个轮廓信息,然后就可以在轮廓结果的基础上,进行二次插值来平滑轮廓计算结果,之后再筛选掉一些非常小的区域轮廓多边形即可。
- 机器学习驱动的生物标志物发现与疾病预测集成工具包 - 2025年10月7日
- CCL对象检测算法 - 2025年8月11日
- Boids鸟群模拟算法讲解 - 2025年8月10日


7 Responses
ご提供いただきましたこの研究ツールに心より感謝申し上げます。お示しいただいたサンプルコードから見ますと、この方法は非常に使いやすいようです。しかし、実際のデータに適用する際、アルゴリズムがシングルスレッドであるため、大規模な空間代謝組学の生データを可視化する場合、計算プロセスが非常に長時間に及ぶ可能性があります。マルチスレッド計算を可能にした最適化版をご提供いただければ、使用体験が大幅に向上すると思われます。以上、私の個人的な使用感でございます。
(●’◡’●) 谢老师你好
你好
Отлично, друг мой! Недавно я как раз разберусь с иллюстрациями для моей статьи по масс-спектрометрической визуализации с помощью этого метода. За это! 🥂
Cheers!🍷
An impressive share! I’ve just forwarded this to a friend who had been conducting a little homework on this.
And he in fact ordered me dinner due to the fact that I found it for him… lol. So let me reword this…
Thanks for the meal!! But yeah, thanks for spending the time to discuss this topic here on your website.
You’re welcome