文章阅读目录大纲
单细胞分析方法学习文献打卡记录:

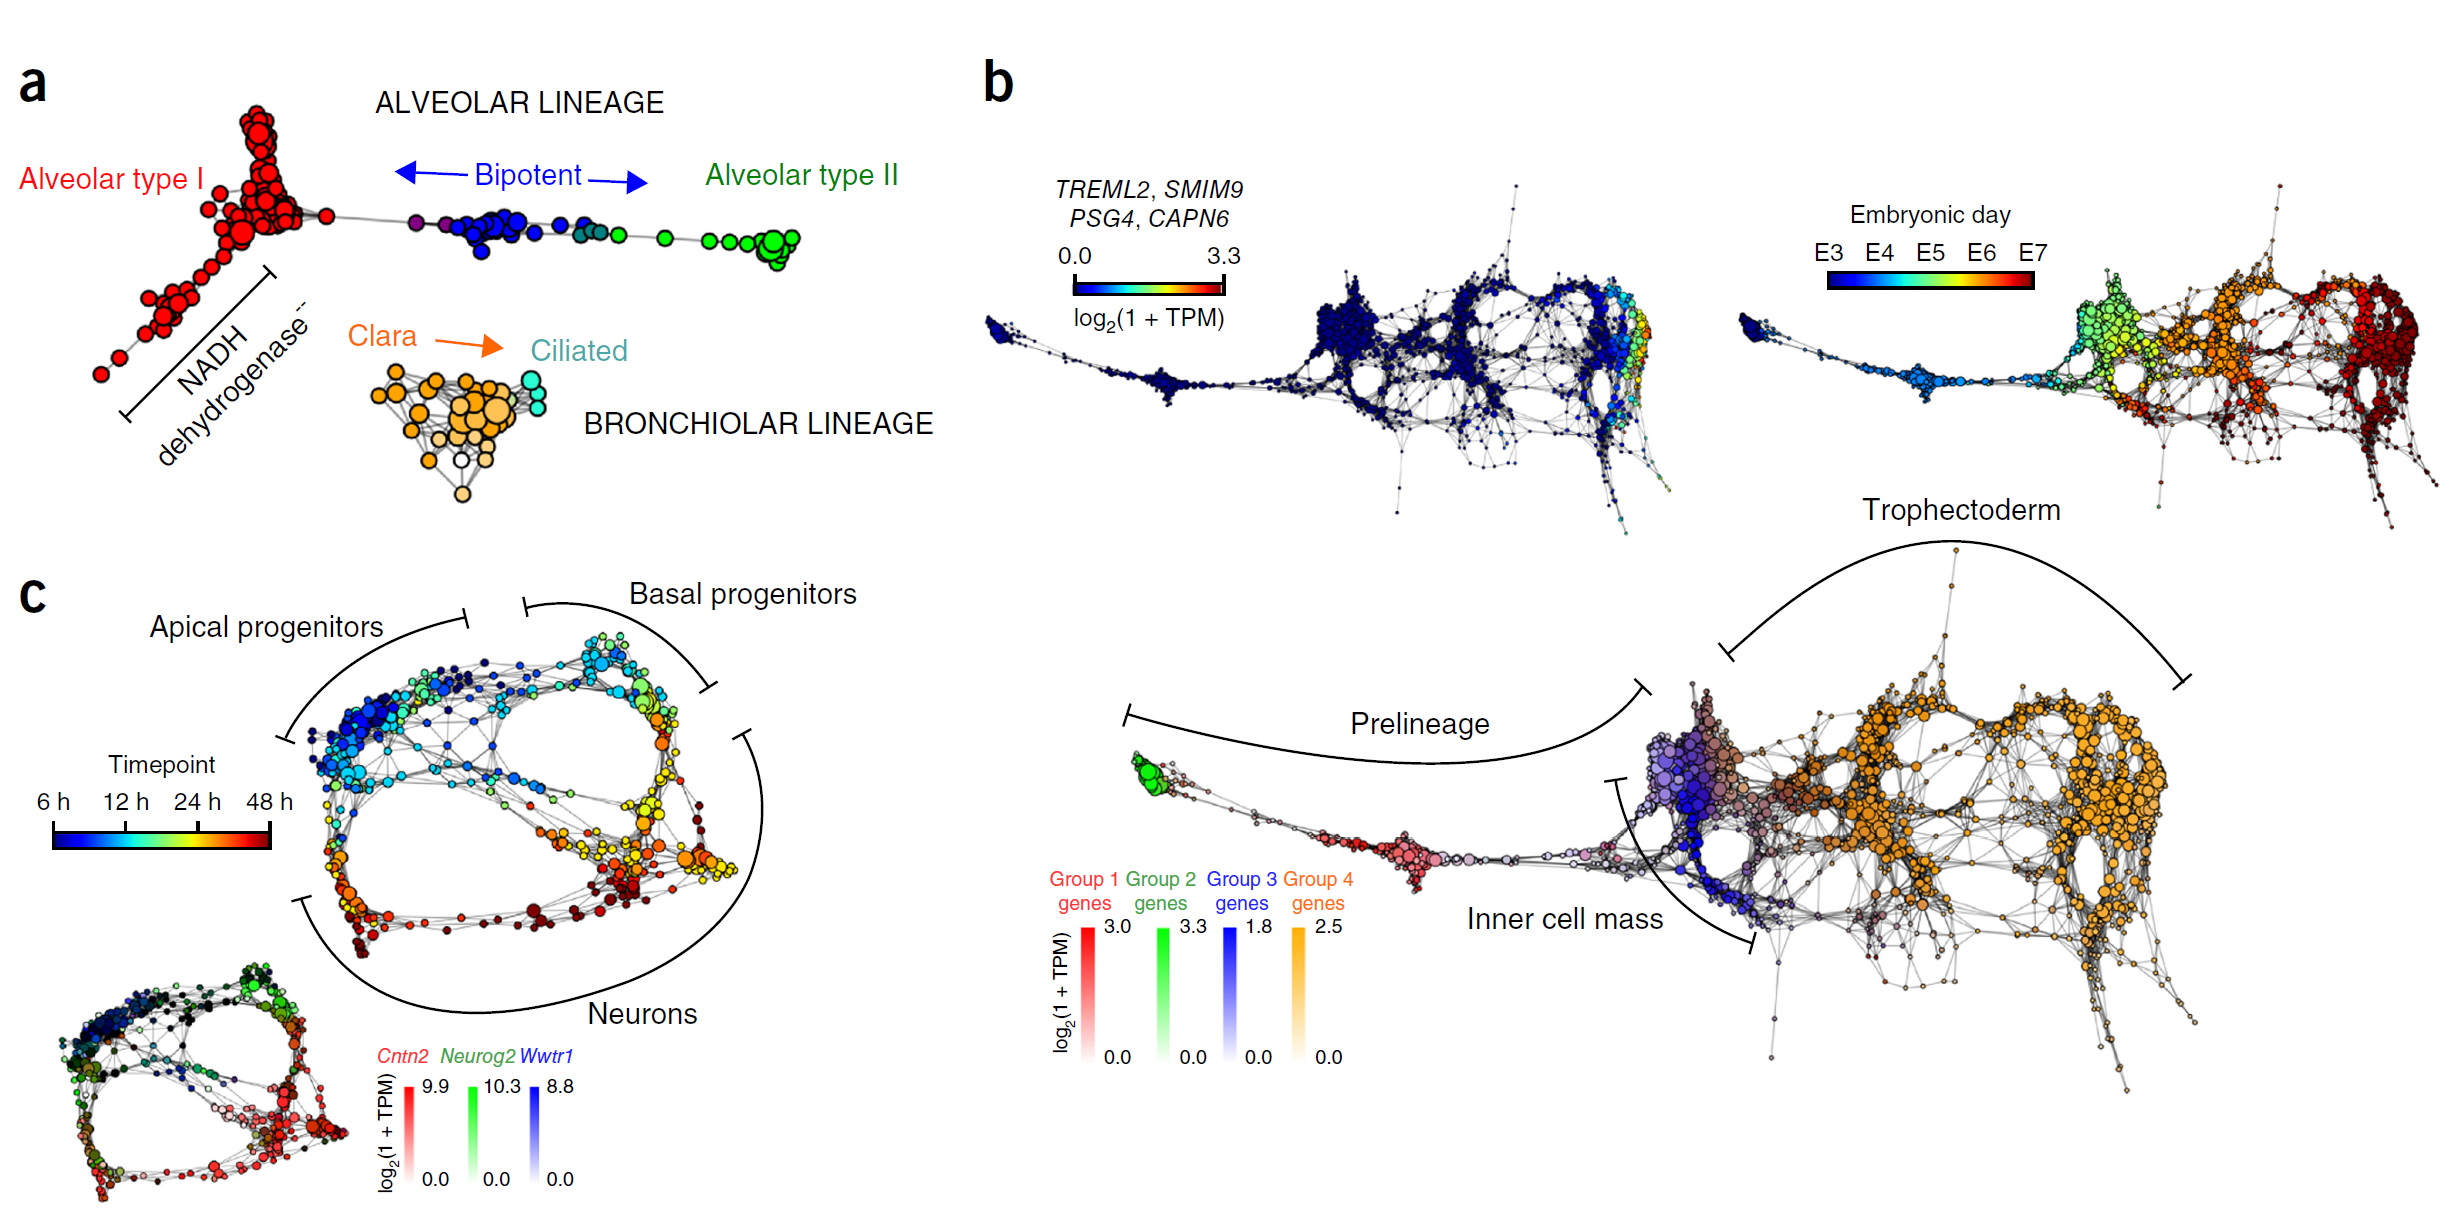
Rizvi, A., Camara, P., Kandror, E. et al. Single-cell topological RNA-seq analysis reveals insights into cellular differentiation and development. Nat Biotechnol 35, 551–560 (2017). https://doi.org/10.1038/nbt.3854
Figure 4 Cellular populations during motor neuron differentiation. (a) scTDA identifies four transient populations in mESC differentiation into MNs. Represented is the topological representation (colored by mRNA levels) of four groups of low-dispersion genes: pluripotent, precursor, progenitor, and postmitotic populations. In total, 488 genes were assigned to one of these four populations based on their expression profiles in the topological representation. TPM, transcripts per million. (b) Reconstructed expression timeline for each of the four groups of low-dispersion genes. (c) Validation by detection of state-specific cell-surface markers identified by scTDA. Left, topological representation (colored by mRNA levels) of surface proteins Pecam1, Ednrb, and Slc10a4; right, immunostaining of cultured EBs. Scale bar, 50 μm. Details of three regions are presented at the far right. For reference, the topological representation colored by mRNA levels of the Mnx1-eGFP reporter is also shown. (d) In vivo validation of the motor neuron surface marker Slc10a4. Spinal cord section from an E9.5 mouse immunostained for Slc10a4 (red). The pool of motor neurons is also marked by Mnx1-eGFP expression (green). Scale bar, 50 μm.
Topological representation
-
In brief, the processed RNA-seq data was endowed with a dissimilarity matrix by taking pairwise correlation distance (1 – Pearson correlation). To minimize the effect of dropout events present in single-cell data, we only considered the 5,000 genes (for experi ment 1) and the 4,600 genes (for experiment 2) with highest variance across each data set.
-
The space was reduced to R2 using MDS. A covering of R2 consisting of 26 × 26 and 62 × 62 rectangular patches was considered for experiments 1 and 2, respectively. The size of the patches was chosen such that the number of cells in each row or column of patches was the same, avoiding sampling-density biases. The overlap between patches was 66% (on average).
-
Single-linkage clustering was performed in each of the pre-images of the patches using the algorithm described in Singh et al.19. A network was constructed in which each vertex corresponds to a cluster, and edges correspond to nonvanishing intersections between clusters.
Gene connectivity, centroid, and dispersion within the topological rep resentation
A notion of gene connectivity in the topological representation was introduced, defined as:

where ei,α represents the average expression of gene i in node α of the topological representation, normalized as described in the paragraph “Processing of single cell RNA-seq data”. Γ denotes the set of nodes of the topological representation, Aα,β is its adjacency matrix, and N is the total number of nodes. With this normalization, si takes values between 0 and 1.
To assess the magnitude of the connectivity score relative to genes with the same expression profile and rank genes accordingly, we introduced a nonparamet ric statistical test. We tested for the null hypothesis of a randomly expressed gene with the same distribution of expression values having a higher gene-connectivity score. To that end, a null distribution was built for each gene i using a permutation test. Cell labels were randomly permuted 5,000 times for each gene, computing si after each permutation. A P value was estimated by counting the fraction of permutations that led to a larger value of si than the original one. Gene connectivity and its statistical significance were computed for each gene expressed in at least three cells. The resulting P values were adjusted for multiple testing by using the Benjamini–Hochberg procedure for controlling the false discovery rate.
Significance of topological features
We computed the first persistent homology group45,46 using the graph distance of the topological representation. Given the pairwise distances of a set of points sampled from a space, persistent homology enables the quantification of topological features (connected components, loops, cavities, etc., preserved under continuous deformations of the space) compatible with the data at each scale. The first homology group, in particular, classifies loops of the space.
We use persistent homology death times as a proxy of the size of the loops and evaluated their statistical significance using a permutation test. To that end, we randomly permuted the labels of the genes 500 times for each cell independently. For each permutation we built a topological representation using the same parameters as in the original representation and computed the first persistent homology group. A P value for each of the loops was estimated from the distribution of the number of loops as a function of their death time. The resulting P values were adjusted for multiple testing by using Benjamini–Hochberg procedure for controlling the false-discovery rate.
- R#环境中的热图颜色 - 2025年6月11日
- HE染色结果怎么看 - 2025年6月10日
- 脂质组学概述 - 2025年6月10日


No responses yet