
文章阅读目录大纲
Assembles a manifold that is defined through a series of overlapping, locally-defined PCA subspaces.
- Non-mutual k-nearest-neighborhoods are first obtained for each cell in timepoint i. Neighbor edges are queried from timepoints i (within-timepoint edges) and i-1 (link edges) after projecting into a PCA subspace defined by all cells from timepoint i.
- Outgoing edges are then subject to local and global neighborhood restictions.
- The graph is restricted to mutual edges.

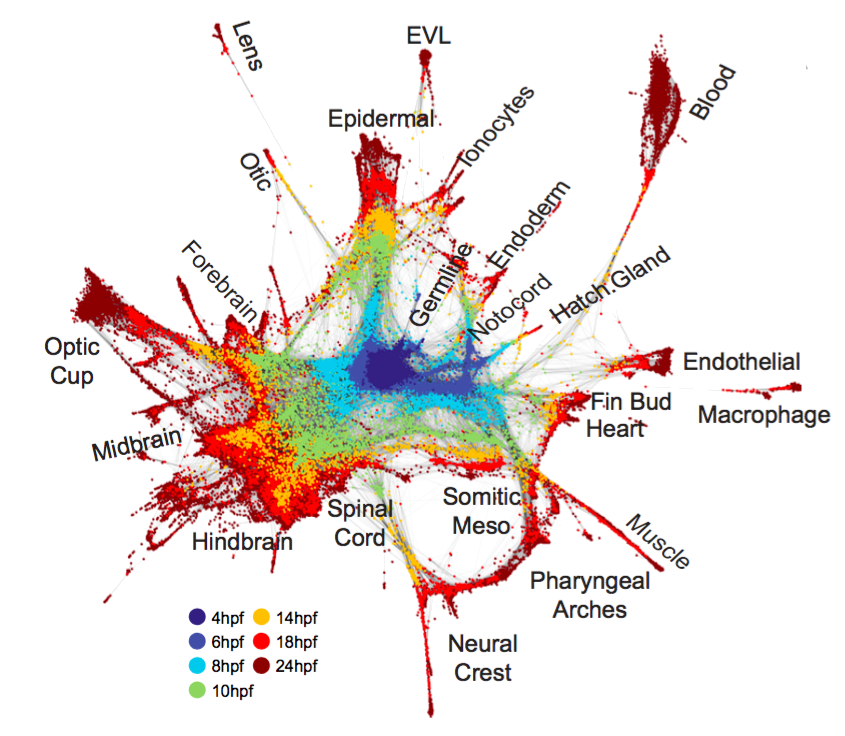
Fig. 2. Single-cell graph reveals a continuous developmental landscape of cell states. (A) Overview of graph construction strategy, and a force-directed layout of the resulting single-cell graph (nodes colored by collection timepoint). For each cell, up to 20 within- or between-timepoint mutual nearest neighbor edges are retained. (B) Single-cell graph, colored by germ layer identities inferred from differentially expressed marker genes (see table S2). (C) Single-cell graphs, colored by log10 expression counts for indicated cell type-specific marker genes.
A single-cell graph of cell state progression in the developing zebrafish embryo
We sought to map trajectories of cell state during develop-ment by linking cell states across time. Several computational approaches exist to infer orderings of asynchronous pro-cesses from scRNA-seq data (9–11), typically by projecting all cells into a single low-dimensional latent space. Such strategies may be illsuited to map gene expression in developing embryos, which exhibit dramatically increasing cell state di-mensionality and continuous changes in the sets and num-bers of cell state-defining genes (fig. S2, D and E).
To overcome these obstacles, we developed a graph-based strategy for locally embedding consecutive timepoints on the basis of biological variation that they share, rather than using a global coordinate system for all timepoints.
- This approach first constructs a single-cell k-nearest-neighbor graph for each timepoint ti, with nodes representing cells and edges linking neighbors in a low-dimensional subspace;
- it then joins the graphs by identifying neighboring cells in pairs of adjacent time points, using a coordinate system learned from the future (ti+1) timepoint (see methods).
- The resulting graph spans all time points, and allows application of formal graph-based methods for data analysis.
Single-cell mapping of gene expression landscapes and lineage in the zebrafish embryo. Wagner DE, Weinreb C, Collins ZM, Briggs JA, Megason SG, Klein AM. Science 26 Apr 2018. doi:10.1126/science.aar4362
- 单细胞视角下的微生物基因组代谢酶嵌入分析 - 2026年2月25日
- 基因组代谢酶层级嵌入 - 2026年2月23日
- 基因组功能吉布斯LDA主题建模 - 2026年2月23日

One response
[…] 【单细胞分析方法】单细胞图嵌入 […]