
文章阅读目录大纲
 https://github.com/xieguigang/ms-imaging
Mass spectrometry imaging ( MSI) is a technique used in mass spectrometry to visualize the spatial distribution of molecules, as biomarkers, metabolites, peptides or proteins by their molecular masses. After collecting a mass spectrum at one spot, the sample is moved to reach another region, and so on, until the entire sample is scanned.
在之前的博客文章之中,我们介绍了怎样通过使用mzkit的桌面端软件进行质谱成像的原始数据的查看操作:《【Mzkit教程】查看质谱成像原始文件》。通过基于图形界面的桌面应用程序,我们可以很方便的低门槛的进行原始数据查看。但是桌面端图形化界面存在一个缺点就是:图形界面的应用程序一般在个性化定制上存在难点,并且进行批量化的自动处理会比较困难。
在最近的一段时间为R#脚本语言开发了一个模仿R环境之中的ggplot2程序包的数据可视化程序包模块。实现了一些基本的原始数据可视化功能。在这里我为ggplot程序包进行了一些更加深度的拓展开发,专门开发出来了一个应用于质谱成像的ggplot拓展程序包。因为最近在编写质谱成像的分析流程脚本。这个ggplot的质谱成像拓展程序包刚好很好的解决了自动化处理质谱成像数据可视化的批处理的问题。我将会在这篇文章中为大家讲解这个ggplot的拓展程序包的具体实现原理。
ggplot加载质谱成像原始数据
对于通过使用ggplot程序包进行数据可视化作图,我们一般是通过一个dataframe对象来作为数据源。但是对于质谱成像而言,一般可以通过mzpack原始数据文件来作为数据来源。为了能够让ggplot程序包读取mzpack原始数据文件,我们需要通过aes函数进行数据驱动程序的手动加载。
下面的一段代码展示了如何通过aes函数手动指定数据源的驱动程序的加载操作的:
aes(driver = MSImaging())在底层的VisualBasic代码之中,会存在有一个名称为MSImaging
''' <summary>
''' create a MSI data reader.
''' </summary>
''' <returns></returns>
<ExportAPI("MSImaging")>
Public Function MSIReader() As ggplotReader
    Return New MSIReader
End Function
通过上面的函数所创建的质谱成像原始数据驱动程序,会将传递进来的数据对象直接强行转换为mzpack文件对象,然后基于质谱成像的像素范围创建坐标轴的原始数据,以及创建一个来自于mzkit的核心库文件中的质谱成像原始数据的读取模块。
Public Class MSIReader : Inherits ggplotReader

    Public ReadOnly Property reader As PixelReader

    ''' <summary>
    ''' returns the dimensions of the MSI raw data
    ''' </summary>
    ''' <param name="data"></param>
    ''' <param name="env"></param>
    ''' <returns></returns>
    Public Overrides Function getMapData(data As Object, env As Environment) As ggplotData
        Dim raw As mzPack = DirectCast(data, mzPack)
        Dim points = raw.MS.Select(Function(scan) scan.GetMSIPixel).ToArray
        Dim x As Double() = points.Select(Function(p) CDbl(p.X)).ToArray
        Dim y As Double() = points.Select(Function(p) CDbl(p.Y)).ToArray

        _reader = New ReadRawPack(mzpack:=raw)

        Return New ggplotData With {
            .x = x,
            .y = y
        }
    End Function
End Class
因为MSIReader对象继承自ggplotReader数据读取模块对象,所以基于这个继承关系,我们可以将质谱成像的原始数据读取模块插入到ggplot的内部核心之中,可以让ggplot程序包模块具备有读取质谱成像mzpack原始数据文件的能力。
单分子质谱成像可视化
基于ggplot程序包进行单分子的质谱成像可视化主要是通过geom_msimaging
require(MSImaging);
require(mzkit);
require(ggplot);

options(memory.load = "max");

bitmap(file = `${@dir}/HR2MSI_mouse_urinary_bladder_S096.png`, size = [3300, 2000]) {

    # load mzpack/imzML raw data file
    # and config ggplot data source driver
    # as MSImaging data reader
    ggplot(open.mzpack(system.file("data/HR2MSI mouse urinary bladder S096 - Figure1.cdf", package = "MSImaging")),
           mapping = aes(driver = MSImaging()),
           padding = "padding: 200px 600px 200px 250px;"
    )
       # rendering of a single ion m/z
       # default color palette is Jet color set
       + geom_msimaging(mz = 741.5, tolerance = "da:0.3")
       # add ggplot charting elements
       + ggtitle("MSImaging of m/z 741.5")
       + labs(x = "Dimension(X)", y = "Dimension(Y)")
       + scale_x_continuous(labels = "F0")
       + scale_y_continuous(labels = "F0")
    ;
}下面的一段代码展示了在底层代码之中是如何实现上面的geom_msimaging
Dim rect As Rectangle = canvas.PlotRegion
Dim MSI As Image
Dim engine As Renderer = If(pixelDrawer, New PixelRender, New RectangleRender)
Dim colorSet As String
Dim ion As SingleIonLayer = getIonlayer(mz, mzdiff, ggplot)

If colorMap Is Nothing Then
    colorSet = theme.colorSet
Else
    colorSet = any.ToString(colorMap.colorMap)
End If

MSI = engine.RenderPixels(ion.MSILayer, ion.DimensionSize, Nothing, cutoff:=cutoff, colorSet:=colorSet)
MSI = Drawer.ScaleLayer(MSI, rect.Width, rect.Height, InterpolationMode.Bilinear)

Call g.DrawImage(MSI, rect)

Return New legendColorMapElement With {
    .width = canvas.Padding.Right * (3 / 4),
    .height = rect.Height,
    .colorMapLegend = New ColorMapLegend(colorSet, 100) With {
        .format = "G3",
        .tickAxisStroke = Stroke.TryParse(theme.legendTickAxisStroke).GDIObject,
        .tickFont = CSSFont.TryParse(theme.legendTickCSS).GDIObject(g.Dpi),
        .ticks = ion.GetIntensity.Range.CreateAxisTicks,
        .title = $"m/z {mz.ToString("F3")}",
        .titleFont = CSSFont.TryParse(theme.legendTitleCSS).GDIObject(g.Dpi),
        .noblank = True,
        .legendOffsetLeft = canvas.Padding.Right / 10
    }
}
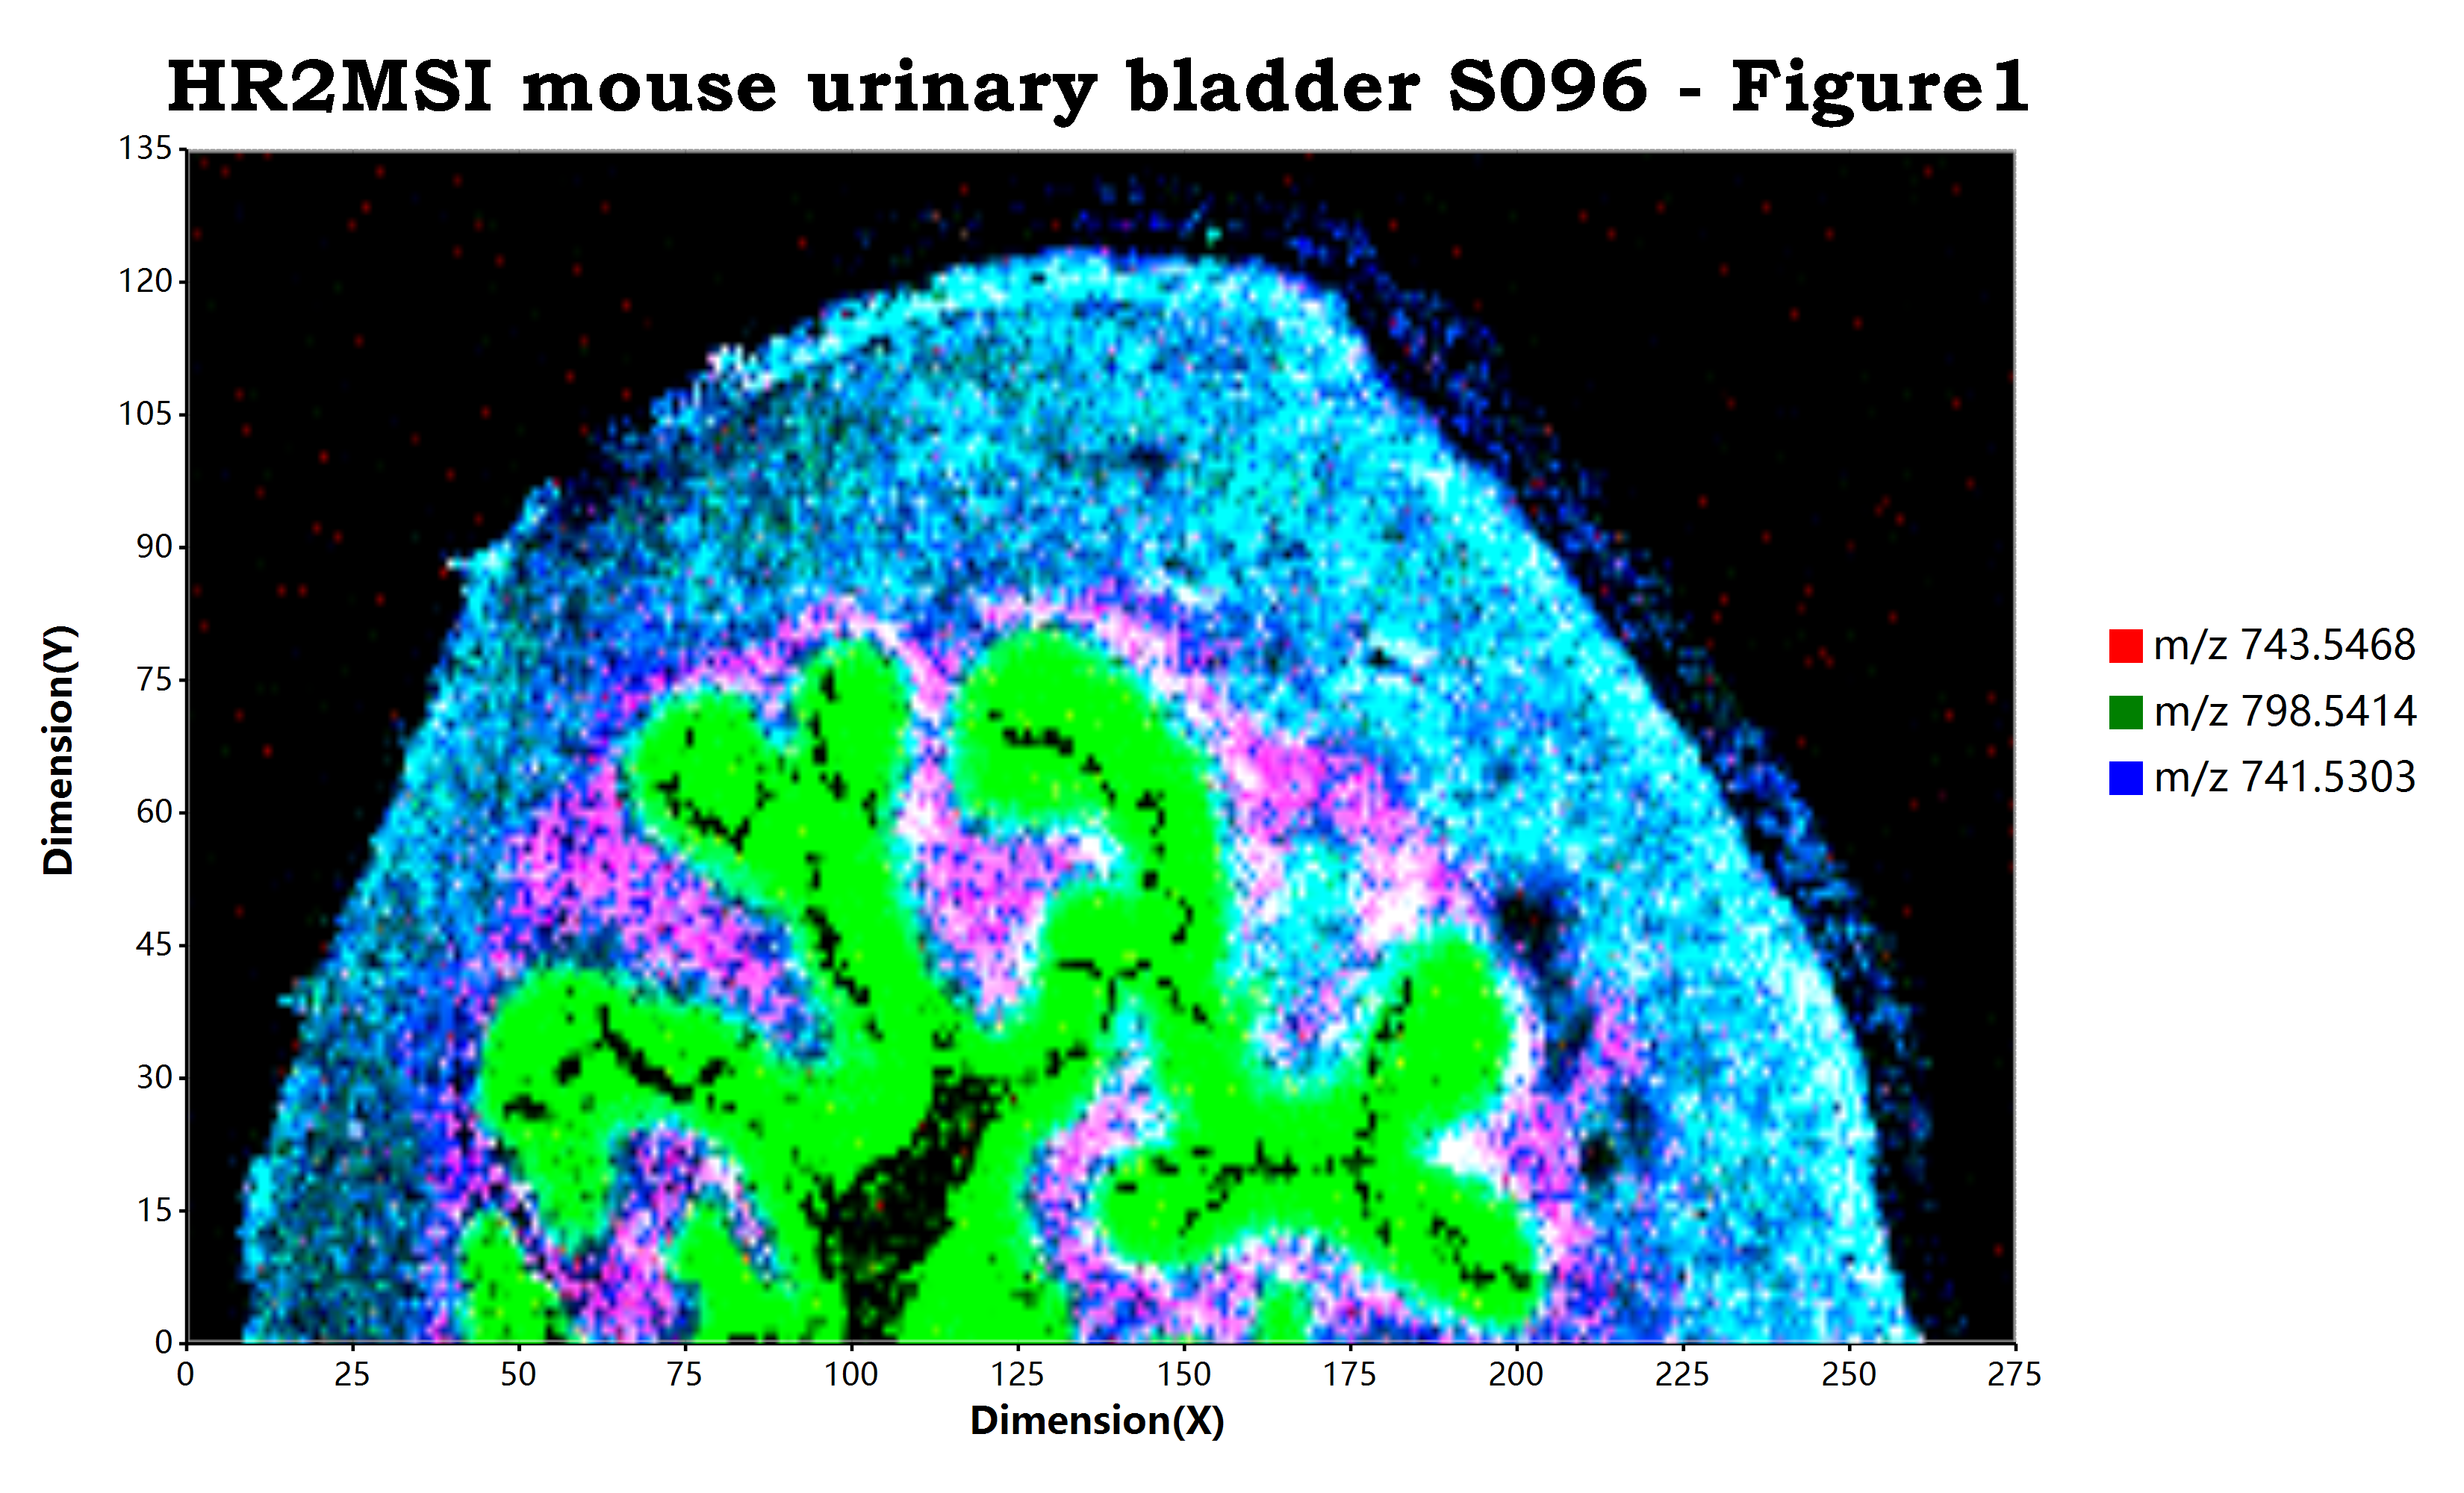
离子RGB通道叠加质谱成像
在质谱成像可视化操作之中,除了对单分子的质谱成像之外,还存在有对至多三种离子的叠加可视化的操作。为什么至多只能叠加三种离子数据,这个是因为在gdi+
require(MSImaging);
require(mzkit);
require(ggplot);

options(memory.load = "max");

bitmap(file = `${@dir}/HR2MSI_mouse_urinary_bladder_S096_RGB.png`, size = [3300, 2000]) {

    # load mzpack/imzML raw data file
    # and config ggplot data source driver
    # as MSImaging data reader
    ggplot(open.mzpack(system.file("data/HR2MSI mouse urinary bladder S096 - Figure1.cdf", package = "MSImaging")),
           mapping = aes(driver = MSImaging()),
           padding = "padding: 200px 600px 200px 250px;"
    )
       # rendering of rgb channels ion m/z
       + geom_red(mz = 743.5468, tolerance = "da:0.3")
       + geom_green(mz = 798.5414, tolerance = "da:0.3")
       + geom_blue(mz = 741.5303, tolerance = "da:0.3")
       # add ggplot charting elements
       + ggtitle("HR2MSI mouse urinary bladder S096 - Figure1")
       + labs(x = "Dimension(X)", y = "Dimension(Y)")
       + scale_x_continuous(labels = "F0")
       + scale_y_continuous(labels = "F0")
    ;
}在RGB通道叠加渲染操作之中,可以通过geom_red/geom_green/geom_blue
Dim rect As Rectangle = canvas.PlotRegion
Dim MSI As Image
Dim engine As Renderer = If(pixelDrawer, New PixelRender, New RectangleRender)
Dim redLayer As SingleIonLayer = DirectCast(red, MSIChannelLayer).getIonlayer(ggplot)
Dim greenLayer As SingleIonLayer = DirectCast(green, MSIChannelLayer).getIonlayer(ggplot)
Dim blueLayer As SingleIonLayer = DirectCast(blue, MSIChannelLayer).getIonlayer(ggplot)
Dim qcutRed As DoubleRange = {0, Renderer.AutoCheckCutMax(redLayer.GetIntensity, 0.8)}
Dim qcutGreen As DoubleRange = {0, Renderer.AutoCheckCutMax(greenLayer.GetIntensity, 0.8)}
Dim qcutBlue As DoubleRange = {0, Renderer.AutoCheckCutMax(blueLayer.GetIntensity, 0.8)}
Dim dims As New Size With {
    .Width = {redLayer.DimensionSize.Width, greenLayer.DimensionSize.Width, blueLayer.DimensionSize.Width}.Max,
    .Height = {redLayer.DimensionSize.Height, greenLayer.DimensionSize.Height, blueLayer.DimensionSize.Height}.Max
}

MSI = engine.ChannelCompositions(redLayer, greenLayer, blueLayer, dims, Nothing, cut:=(qcutRed, qcutGreen, qcutBlue), background:="black")
MSI = Drawer.ScaleLayer(MSI, rect.Width, rect.Height, InterpolationMode.Bilinear)
- 单细胞视角下的微生物基因组代谢酶嵌入分析 - 2026年2月25日
- 基因组代谢酶层级嵌入 - 2026年2月23日
- 基因组功能吉布斯LDA主题建模 - 2026年2月23日

4 Responses
really superb style and perfect written content. really help me 😊😊😊 thx
I’ve been exploring for a little for any high-quality articles or weblog posts in this kind of
house . Exploring in Yahoo I finally stumbled upon this website.
Studying this information So i am satisfied to express that I
have an incredibly excellent uncanny feeling I found out just what I needed.
I such a lot without a doubt will make certain to don?t disregard this site and provides it a glance regularly.
This site was… how do you say it? Relevant!! Finally I’ve found something which helped
me. Kudos!
I go to see day-to-day a few sites and websites to read articles or
reviews, but this weblog gives quality based content.