
文章阅读目录大纲
 https://github.com/xieguigang/sciBASIC
最近在研究实现空间代谢组学中的一些特征区域的自动化划分分割。在得到了特征点集合之后,我们需要根据一些图像处理算法进行特征区域的提取操作。之前,我们尝试过基于绘制等高线图Marching Squares
在Google了一些轮廓算法之后,搜索到了一个在这方面的工作应用上比较合适的方法:Contour Tracing。Contour Tracing,也称为border following或boundary following,即轮廓追踪算法,是一种在图像处理中广泛使用的技术。该算法主要用于从二维图像中基于特定阈值提取轮廓(contours)。在计算机图形学领域,这个问题有比较成熟的解决方案。轮廓追踪算法的核心思想是沿着图像中物体的边界进行跟踪,从而提取出物体的轮廓信息。这种技术在目标识别、图像分割和物体分析等应用中非常重要。轮廓面积的计算通常基于格林公式(Green's theorem)来实现数学上对于平面闭合曲线所围成区域的面积计算。这一数学原理为轮廓分析提供了理论基础。contour的概念在不同领域有不同应用。contour tracing可以用于绘制矩阵的等高线,表示距X-Y平面的高度。同时,contour tracing技术也被用于分析数据生成等值面图片。
基于Contour Tracing的方法进行空间代谢组学中的一些特征区域的自动化提取。在Github上,我找到了一个比较好的基于rust语言编写的Contour Tracing方法的实现项目,依照着这个项目,进行了相关的算法的VisualBasic语言上的实现,相关的源代码在这里分享给大家。
A 2D library to trace contours.
contours: an array of contours
  ol: outlines level
  hl: holes level
  rn: reachable neighbor - For the outlines: 0: none, 1: front left,  2: front, 3: front right
                         - for the holes:    0: none, 1: front right, 2: front, 3: front left
   o: orientation, e.g. to the east:

          N
    ┏━━━━━━━━━━━┓
    ┃ 7   0   1 ┃
  W ┃ 6   o > 2 ┃ E   o = [2, 3, 4, 5, 6, 7, 0, 1]
    ┃ 5   4   3 ┃
    ┗━━━━━━━━━━━┛
          S
What is Contour Tracing?
Also known as border following or boundary following; contour tracing is a technique that is applied to digital images in order to extract their boundary.Contour tracing is one of many preprocessing techniques performed on digital images in order to extract information about their general shape. Once the contour of a given pattern is extracted, it's different characteristics will be examined and used as features which will later on be used in pattern classification. Therefore, correct extraction of the contour will produce more accurate features which will increase the chances of correctly classifying a given pattern.
- Square Tracing Algorithm
- Moore-Neighbor Tracing
- Radial Sweep
- Theo Pavlidis' Algorithm
以下是轮廓追踪算法(Contour Tracing)的具体实现细节,简单的总结下,结合算法设计原则和图像处理逻辑综合说明,我们可以用自然语言描述出下面的计算算法:
- 起点定位
从图像左上角开始逐像素扫描,找到第一个满足阈值条件的像素点(如灰度值大于设定阈值)作为轮廓起点。
关键点:需确保该点位于目标物体边界,且未被访问过。 - 方向初始化
设定初始搜索方向(如右方),采用8邻域编码(0°、45°、90°…315°)表示8个可能的方向。
示例:若初始方向为右(0°),则按顺时针顺序依次检查右→右下→下→左下→左→左上→上→右上。 - 边界跟踪规则
- 当前点处理:记录当前像素坐标,将其标记为已访问。
- 方向决策:
- 从当前方向开始,按顺时针顺序检查8邻域像素。
- 若找到下一个未访问的边界像素,则移动到该点,并更新方向为该点相对于当前点的方向。
- 若未找到边界像素,则回溯到上一个点,继续检查剩余方向。
逻辑:通过方向偏移量(如dx = [1,1,0,-1,-1,-1,0,1],dy = [0,1,1,1,0,-1,-1,-1])实现坐标计算。
- 循环终止条件
当跟踪回到起点且无未访问的相邻边界点时,结束当前轮廓的跟踪。
Moore-Neighbor Tracing
Moore-Neighbor Tracing在轮廓计算算法之中,我们假设一个2D图像上只有两种值:0和1。0表示背景,即无信息的区域,而1表示样本点,即我们所需要进行轮廓计算的目标区域。则根据算法,我们只需要对样本点进行依次扫描即可:
For cursor_y As Integer = 1 To rows
    ol = 1
    hl = 1

    For cursor_x As Integer = 1 To cols
        If ol = hl AndAlso contours(cursor_y)(cursor_x) = 1 Then
            Call trace(True, cursor_x, cursor_y, {2, 3, 4, 5, 6, 7, 0, 1}, 2, (7, 1, 0), O_VERTEX, O_VALUE, contours, paths)
        ElseIf ol > hl AndAlso contours(cursor_y)(cursor_x) = -1 Then
            Call trace(False, cursor_x, cursor_y, {4, 5, 6, 7, 0, 1, 2, 3}, -2, (1, 7, 6), H_VERTEX, H_VALUE, contours, paths)
        End If

        Select Case stdNum.Abs(contours(cursor_y)(cursor_x))
            Case 2, 4, 10, 12
                If contours(cursor_y)(cursor_x) > 0 Then
                    ol += 1
                Else
                    hl += 1
                End If
            Case 5, 7, 13, 15
                If contours(cursor_y)(cursor_x) > 0 Then
                    ol -= 1
                Else
                    hl -= 1
                End If
        End Select
    Next
Next
在进行扫描的时候,由[x, y]
Do
    neighbors = {
        contours(tracer_y - 1)(tracer_x),
        contours(tracer_y - 1)(tracer_x + 1),
        contours(tracer_y)(tracer_x + 1),
        contours(tracer_y + 1)(tracer_x + 1),
        contours(tracer_y + 1)(tracer_x),
        contours(tracer_y + 1)(tracer_x - 1),
        contours(tracer_y)(tracer_x - 1),
        contours(tracer_y - 1)(tracer_x - 1)
    }

    rn = getRn(neighbors, outline, o)

    ' ...
Loop
接着呢,我们就可以在坐标点P的基础上,构建出相邻的8个像素点的矩阵用于描绘轮廓信息。在Moore-Neighbor Tracing

在改进型的Moore-Neighbor
contours(tracer_y)(tracer_x) += value(o(0))
tracer_x = tracer_x + MN(o(viv.Item1)).Item1
tracer_y = tracer_y + MN(o(viv.Item1)).Item2
vertices_nbr += 1

' Rotate 90 degrees, counterclockwise For the outlines (rot = 2)
' or clockwise For the holes (rot = -2)
Call o.RotateRight(rot.rem_euclid(8))

If o(0) = 0 OrElse o(0) = 4 Then
    paths.LineTo(tracer_x + vertex(o(0)).Item1, tracer_y)
Else
    paths.LineTo(tracer_x, tracer_y + vertex(o(0)).Item2)
End If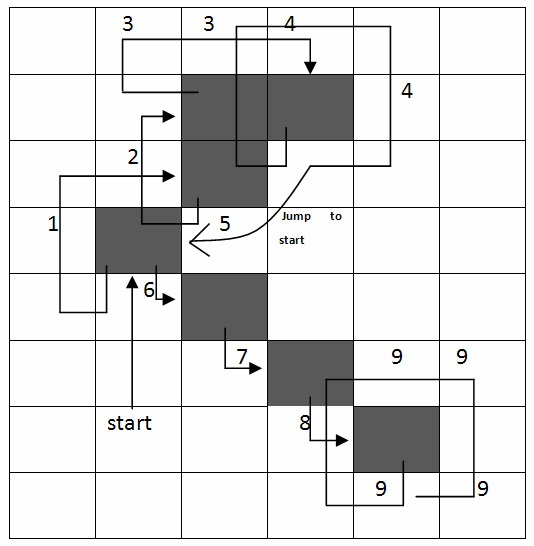
上面所实现的Contour Tracing算法的源代码,大家可以阅读源代码文件MarchingSquares/ContourTracing.vb
在R#
R#我已经将所实现的Contour Tracing算法集成在了R#语言的2D图形库之中了,大家可以直接使用contour_tracing
require(graphics2D);
# create shape outline via contour tracing algorithm
const outline = function(data) {
const x = data[, "X"];
const y = data[, "Y"];
contour_tracing(x, y, 5);
}
let a = read.csv("./region_11.csv", row.names = NULL) |> outline;
let b = read.csv("./region_2.csv", row.names = NULL) |> outline;
let c = read.csv("./region_9.csv", row.names = NULL) |> outline;
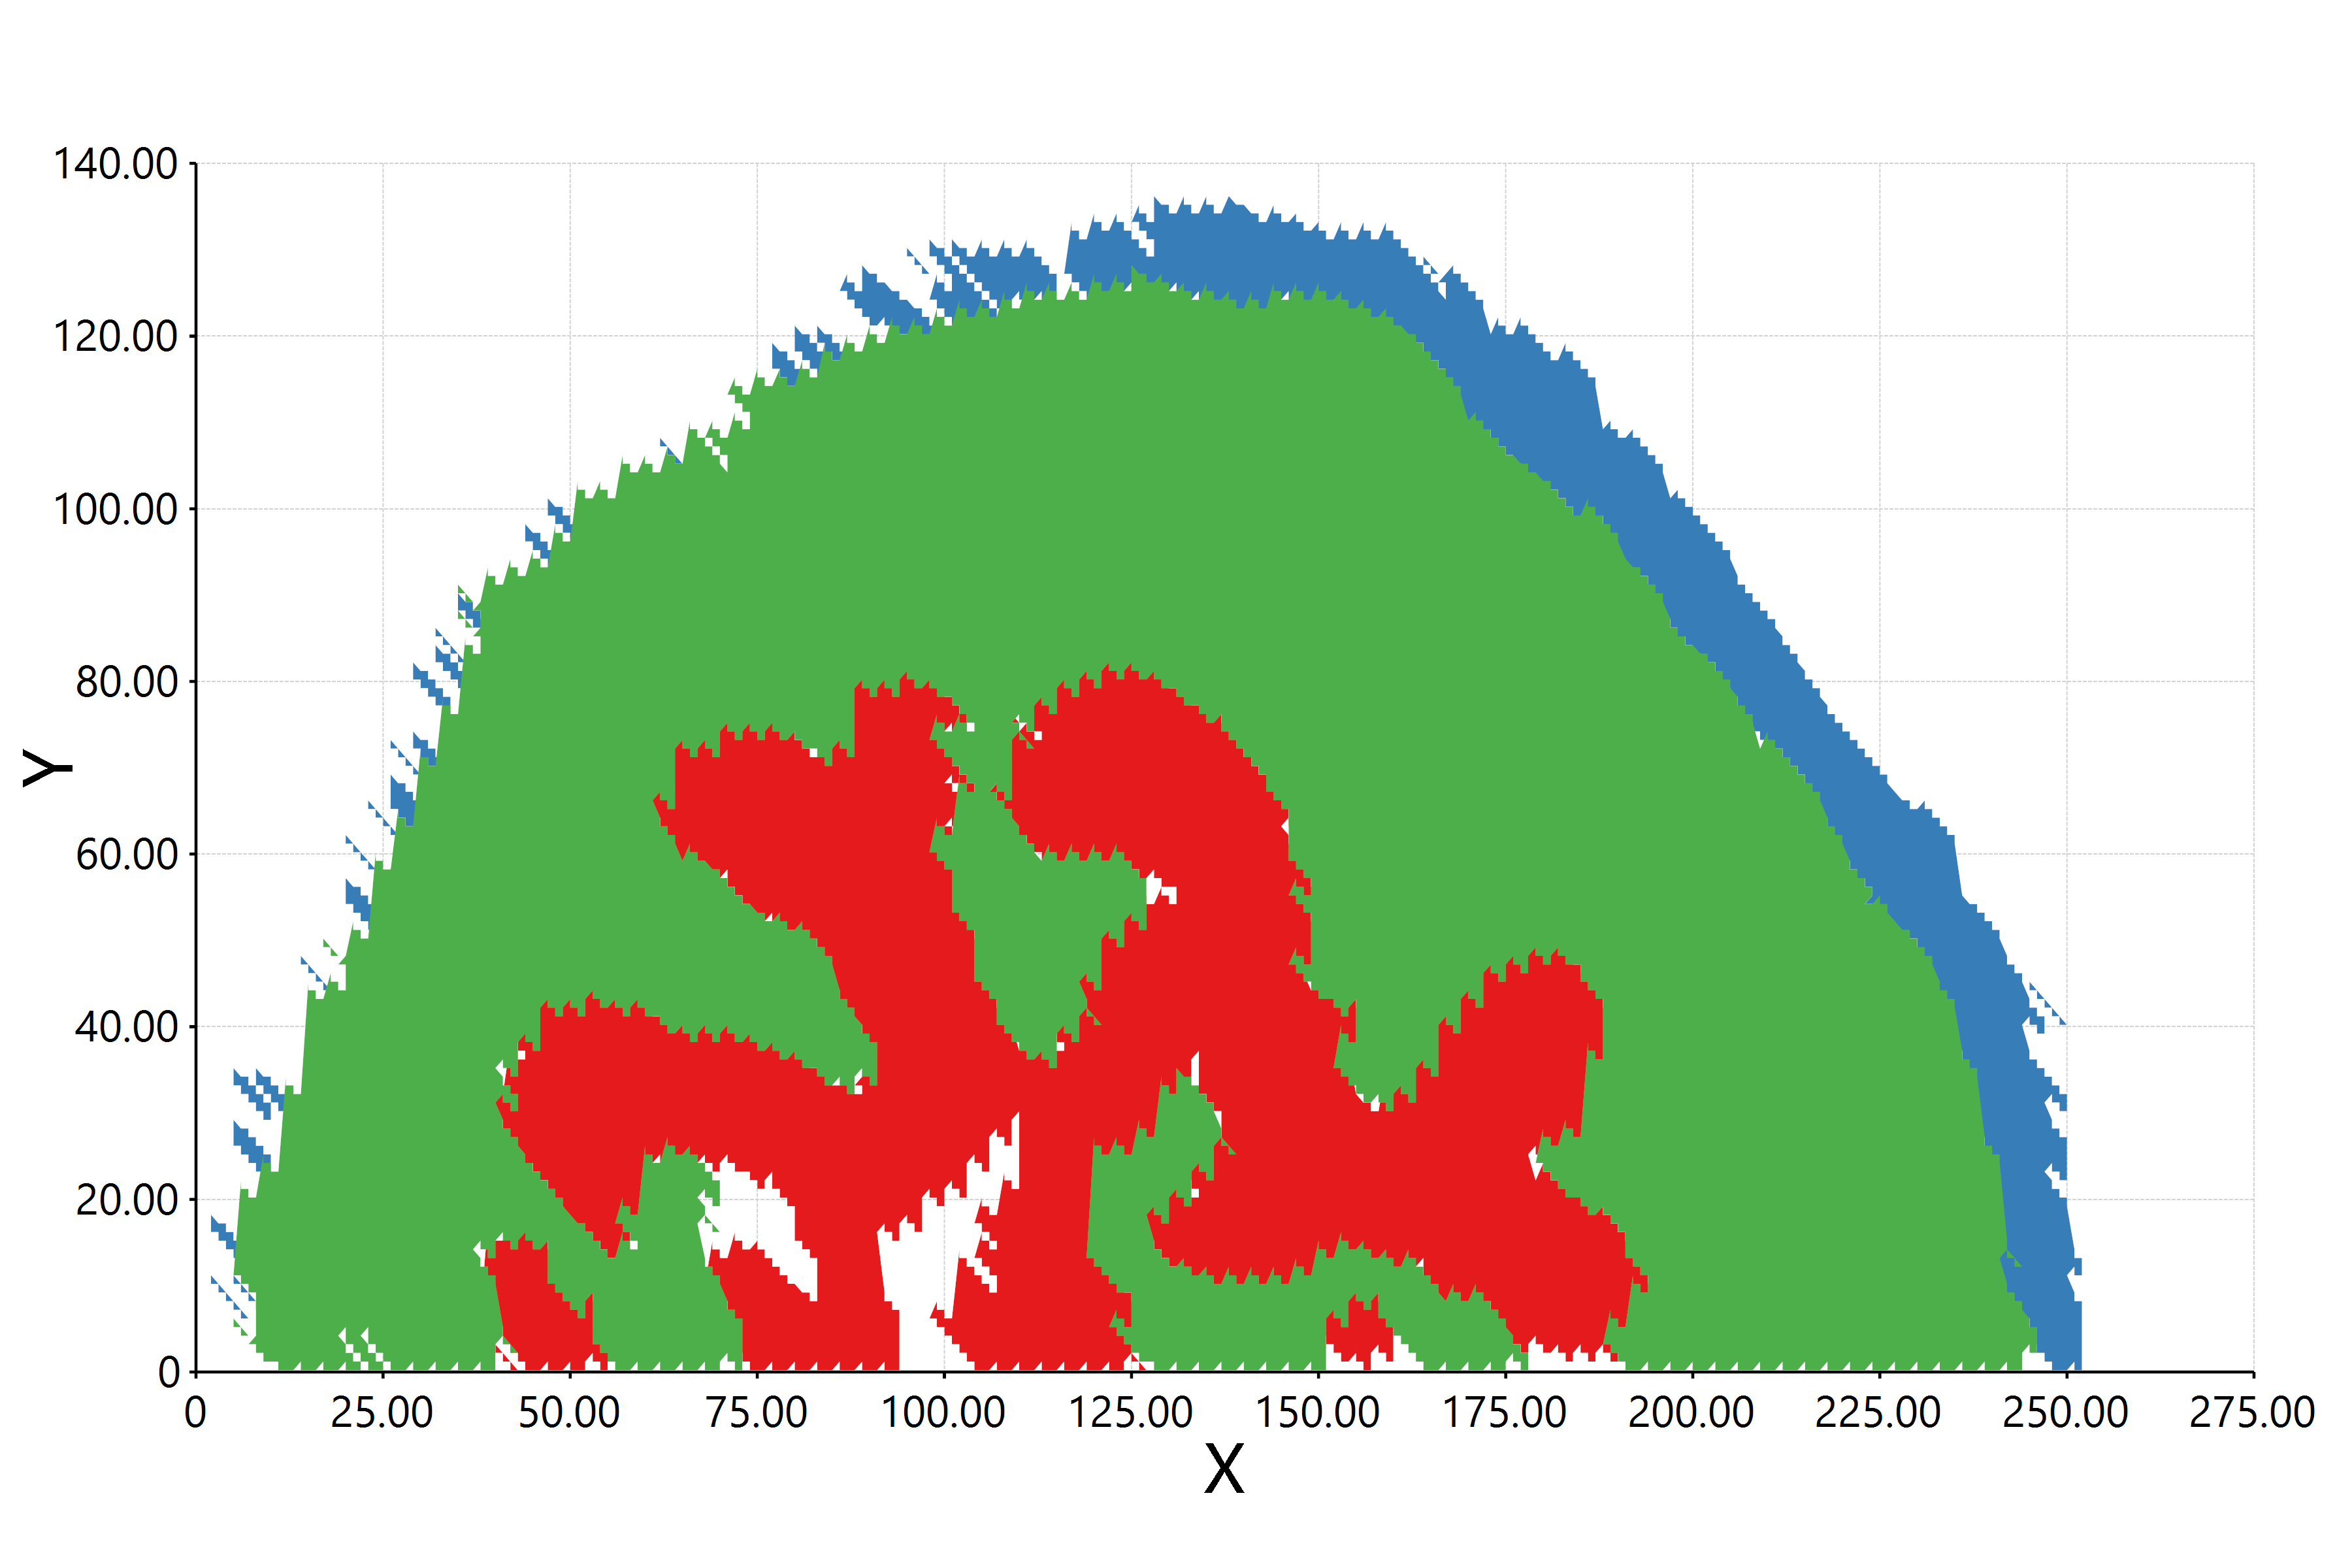
bitmap(file = "./region_unions.png") {
charts::fillPolygon(list(A = a, B = b, C = c), reverse = TRUE);
}
- 单细胞视角下的微生物基因组代谢酶嵌入分析 - 2026年2月25日
- 基因组代谢酶层级嵌入 - 2026年2月23日
- 基因组功能吉布斯LDA主题建模 - 2026年2月23日

6 Responses
Hi, appreciate the effort put into this. It’s always good to see quality content. 🥳
WOOOOOW This was incredibly helpful and easy to understand. I’ve learned a lot. many thanks to your idea sharing.
In the jelly soft body deformation physics engine I’m currently developing, I’ve been experimenting with the Contour Tracing algorithm to dynamically track the contour boundaries of objects after they deform. This helps the physics engine calculate points of force and the range of deformation, which in turn enhances the realism of the simulation. Would you be able to help me modify this algorithm from 2D to 3D?
[…] 【图像处理】基于Contour Tracing 方法获取多边形轮廓 b. […]
[…] 在这里我们所实现的等高线图的绘制算法,实际上就是在不同的高度水平上将基于Marching Squares算法得到的特征区域的多边形轮廓堆叠在一个二维平面上。如果我们将高度信息给忽略掉,只实现一个高度水平的轮廓计算,理论上我们是可以实现类似于Contour Tracing算法相似的多边形轮廓获取的效果。 […]
[…] 之前在阅读一个使用rust语言编写的contour tracing算法模块的源代码的时候,其中有一个向量的左旋以及右旋的操作。这个操作的具体的含义是和在算法中的轮廓边缘像素的读取方向有关:因为访问方向是一个二维平面的概念,但是在代码中我们只能够使用一个一维的数组的来存储这个二维的信息。所以在这段rust代码之中,作者很巧妙的使用了向量的左旋以及右旋操作来实现一维数组中对二维平面上的方位的访问操作。 […]