
文章阅读目录大纲
单细胞轨迹可以揭示基因调控如何控制细胞命运:大多数细胞状态转变,无论是在发育,重编程或者是疾病异常状态,都以基因表达变化的级联为特征。
单细胞数据拟时序分析生物学假设原理
在获取得到的单细胞数据或者空间组数据,都是不同发展时期的细胞的混合数据。例如,即使是某一种类型的细胞,其在单细胞数据中也是由不同时期或者状态的细胞所组成的混合数据。对于空间组数据而言,这种情况很可能就是同一种细胞在正常状态与癌变状态的混合。
因为许多生物学过程中,细胞并不是完全同步的。在细胞分化等过程的单细胞表达研究中,捕获的细胞在分化方面可能分布广泛。所以为了阐述这种混合状态的变化,我们需要开发伪时间序列技术用于分析单细胞数据或者空间数据中的这种状态变化轨迹。
使用轨迹推断(TI,trajectory inference)的方法可以根据测序的细胞(瞬时状态)之间表达模式的相似性对单细胞沿着轨迹进行排序,以此来模拟细胞动态变化的过程。也就是重建分化轨迹或者拟时间轴。
RNA 速率(RNA velocity)
基于RNA velocity的轨迹推断:
- 特定基因的转录诱导导致(新转录的)前体未剪接mRNA的增加,
- 转录的抑制或缺失导致未剪接mRNA的减少。
因此,通过将未剪接的mRNA与成熟的剪接mRNA进行区分,可以近似地得到mRNA丰度的变化。其时间导数,即为RNA速度。基因组内不同基因表达的不同的mRNA速度组合可以用来分类单个细胞的状态。
VeTra的计算方法原理
Guangzheng Weng, Junil Kim, Kyoung Jae Won, VeTra: a tool for trajectory inference based on RNA velocity, Bioinformatics, Volume 37, Issue 20, 15 October 2021, Pages 3509–3513, https://doi.org/10.1093/bioinformatics/btab364

VeTra groups the cells belonging to the same stream of trajectory
VeTra performs lineage tracing from the root to the terminal states by grouping cells based on the similarity in direction of cell transition.
所以基于前面所描述的RNA速率在不同细胞间的差异, VeTra可以通过基于组成相似度的计算方法进行轨迹建模
This enables VeTra to perform TI without prior knowledge or predefined lineage topology.
1. 算法描述
VeTra reconstructs the pseudo-temporal order of cells based on the coordinates and the velocity vector of cells in the low-dimensional embedding.
The velocity vectors are estimated by extrapolating the spliced/unspliced read ratio to the local neighboring cells (La Manno et al., 2018).
RNA速率向量就是 某一个细胞A的剪切/未剪切mRNA的比例值 与 其某一个最邻近细胞B的剪切/未剪切mRNA的比例值 构成的向量
对最邻近细胞的定义: 将单细胞数据进行UMAP降维至二维空间之后,细胞的状态位置可以通过两个UMAP分量构成的平面坐标来表示,则可以基于低维度嵌入结果上的KNN搜索得到某一个细胞A的最邻近细胞B
任意两个最邻近细胞的两个mRNA比例值既可以构成一个从零出发的二维向量,这个二维向量就是RNA velocity向量
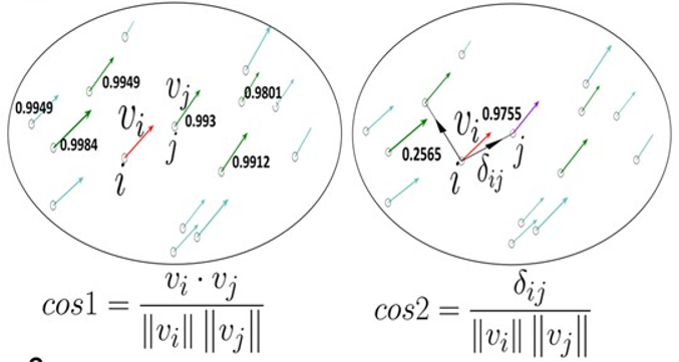
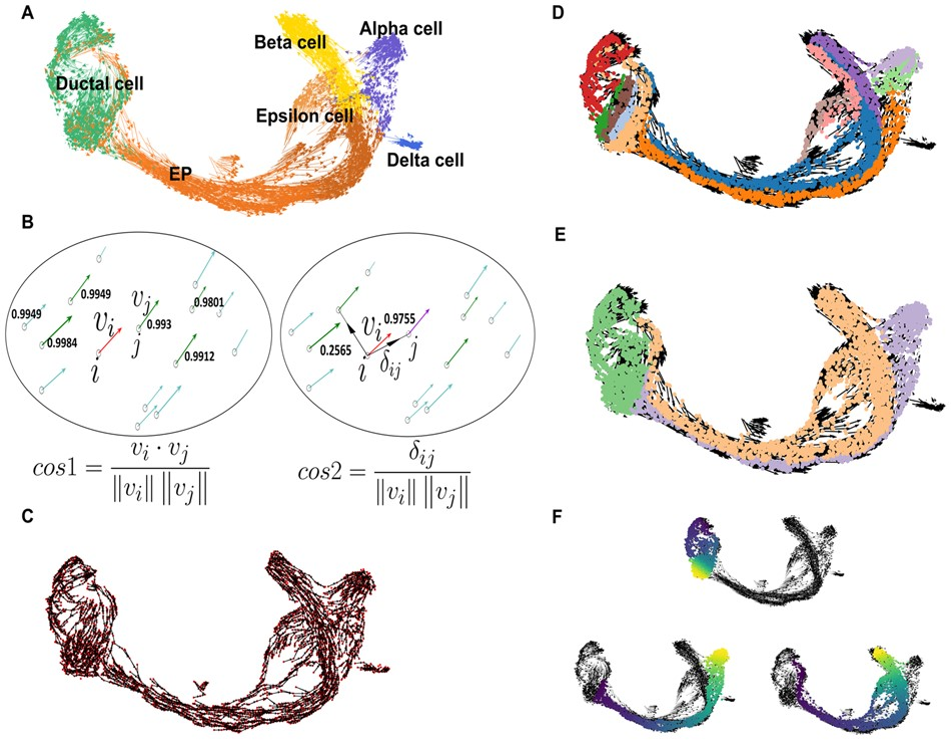
Given velocity vectors, VeTra reconstructs multiple directed graphs.
To link cells based on transition, k nearest neighbors of a cell with similar direction are selected
using cosine similarity (cos1) .
Among them, the nearby cell located upstream with the highest cosine similarity (cos2) is selected
这样基于任意两个RNA velocity二维向量,就可以进行cos相似度计算
基于cos相似度作为距离量度,进行KNN搜索,KNN搜索得到的细胞集合之间就
可以产生一个从搜索点细胞指向K个最邻近细胞的有向图
Once all cells were investigated for their next transition, multiple directed graphs are
obtained. To find a coarse-grained structure of the directed graph, VeTra identifies WCCs where every cell is reachable from every other cell regardless of the direction of relationships
在前面所得到的有向图基础之上,算法会将图中的弱连接子图(WCCs, weak connection components)识别出来。产生网络集群社区划分结果。即可以将整个网络划分为不同颜色的聚类簇。
对划分出来的网络之中的聚类簇,使用层次聚类法进行相互关联关系的建立。簇与簇之间的关联关系即为细胞状态转换关系,即伪时间序列
The grouped WCCs using a hierarchical clustering algorithm.
2. VeTra reconstructs single-cell trajectories for multiple cell lineages

- 单细胞视角下的微生物基因组代谢酶嵌入分析 - 2026年2月25日
- 基因组代谢酶层级嵌入 - 2026年2月23日
- 基因组功能吉布斯LDA主题建模 - 2026年2月23日

2 Responses
You have the gift of turning abstract thoughts into something tangible, allowing the reader to grasp concepts with clarity.
[…] 【单细胞分析方法】VeTra:基于RNA速度的轨迹推断工具 […]