

文章阅读目录大纲
Connected Component Labeling(连通组件标记算法)主要用于识别并标记二值图像中相互连接的像素区域(即连通区域)。
imports "geometry2D" from "graphics";
imports "machineVision" from "signalKit";
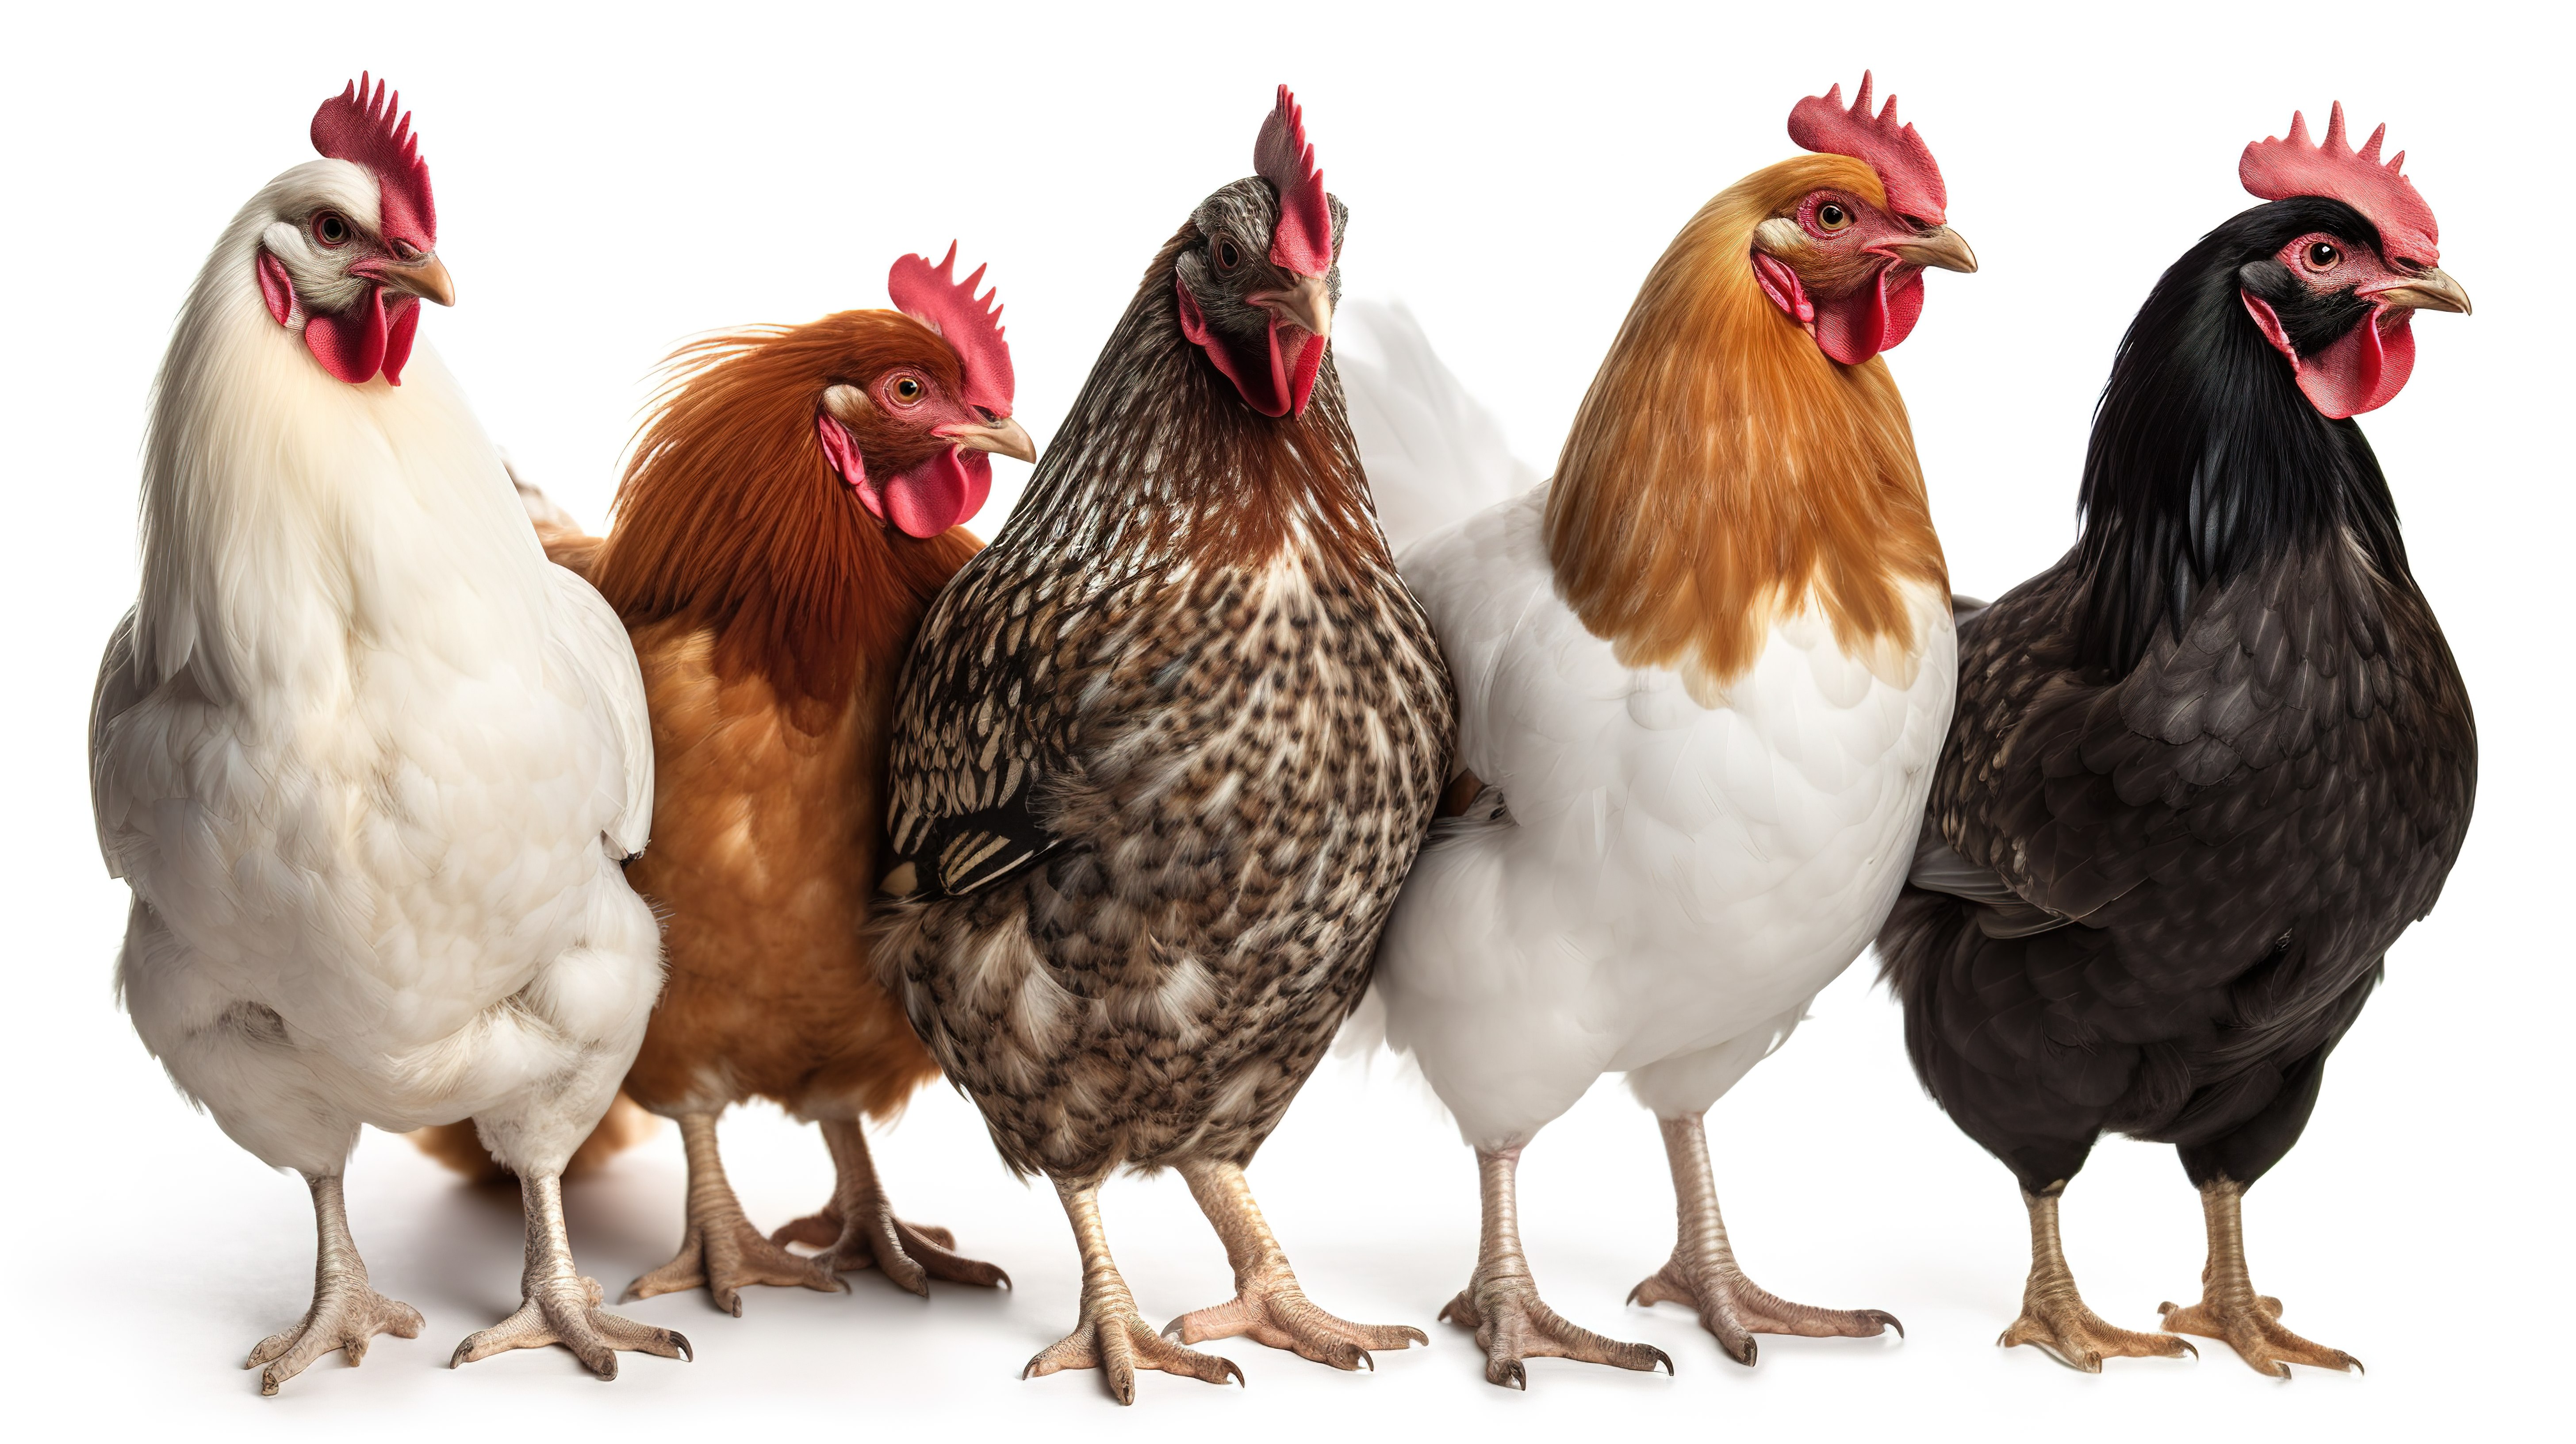
let raw = readImage("—Pngtree—five chickens in different colors_3632916.jpg");
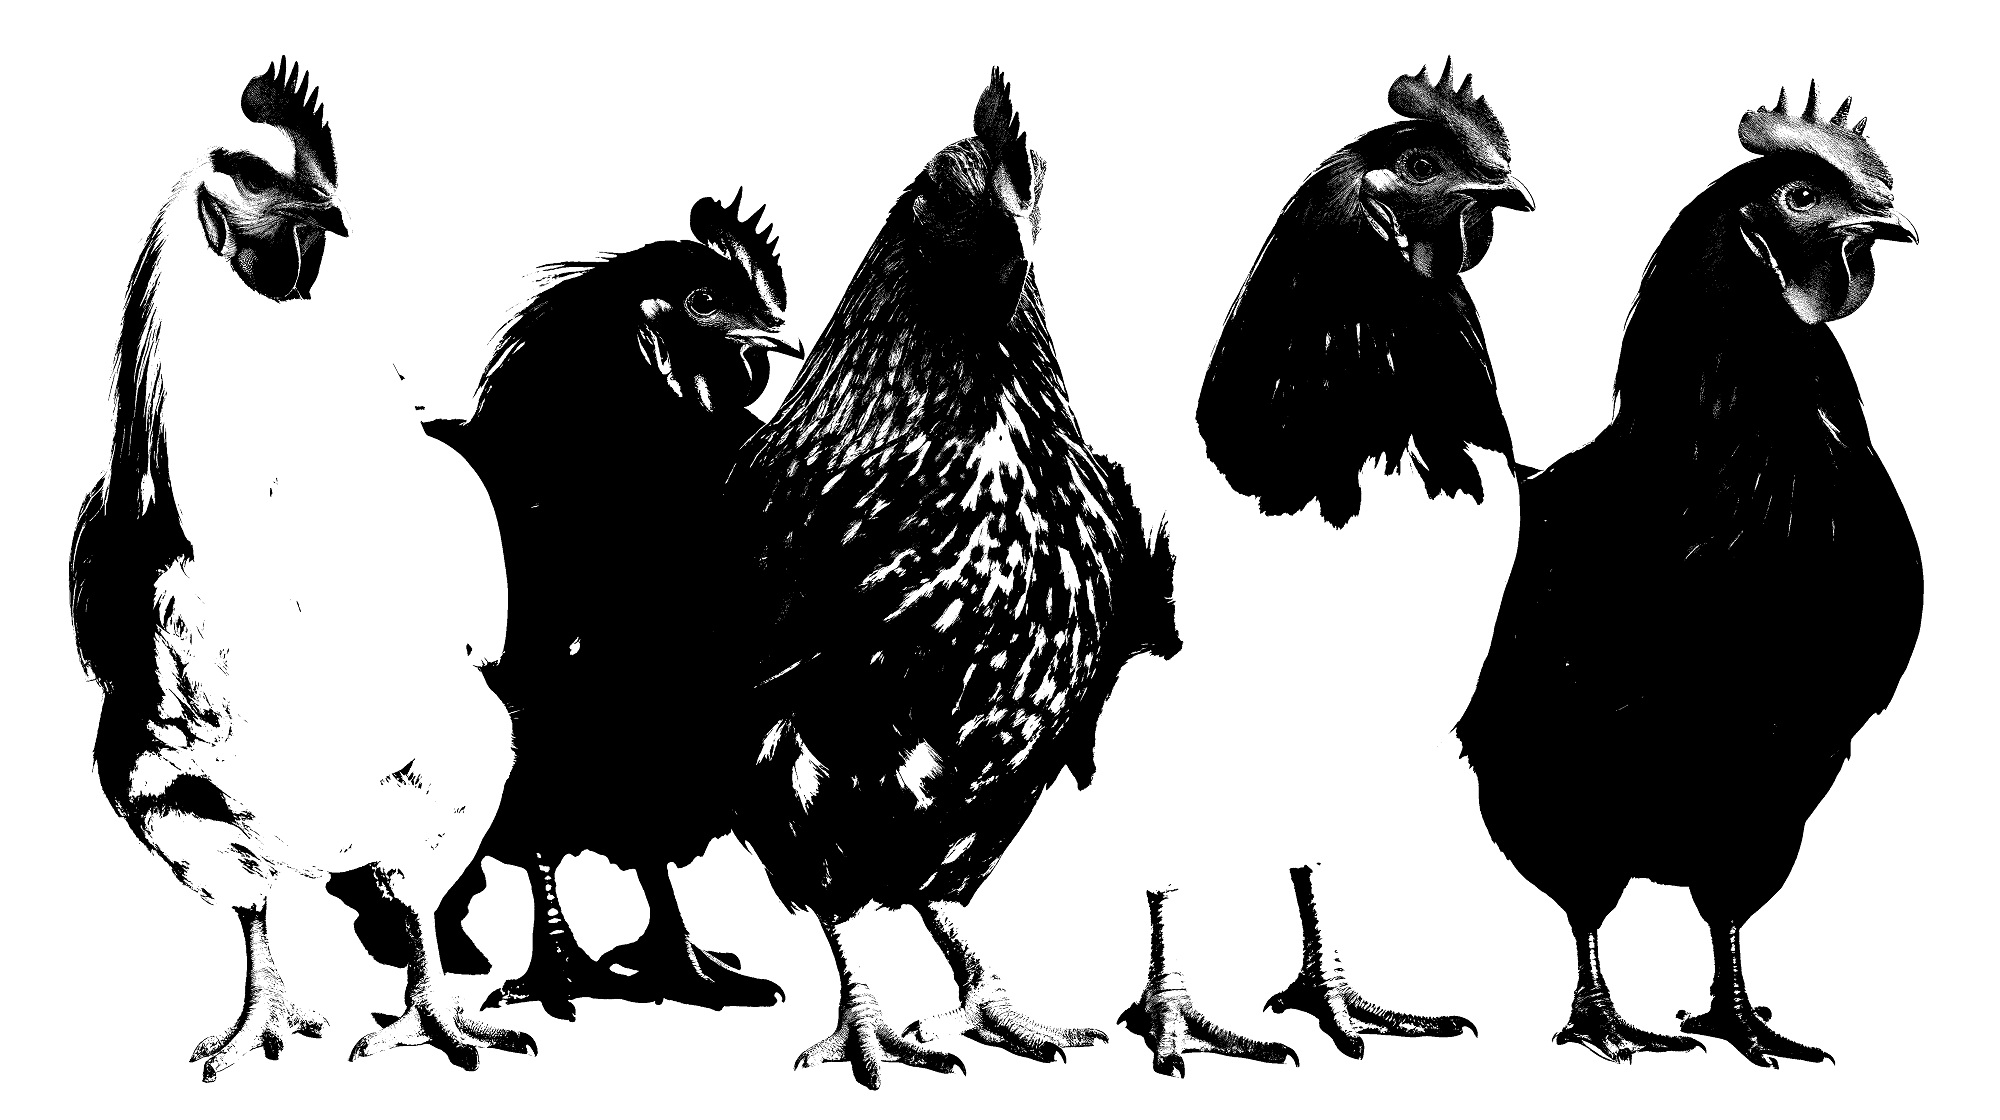
let bin = machineVision::ostu(raw, factor = 0.8);
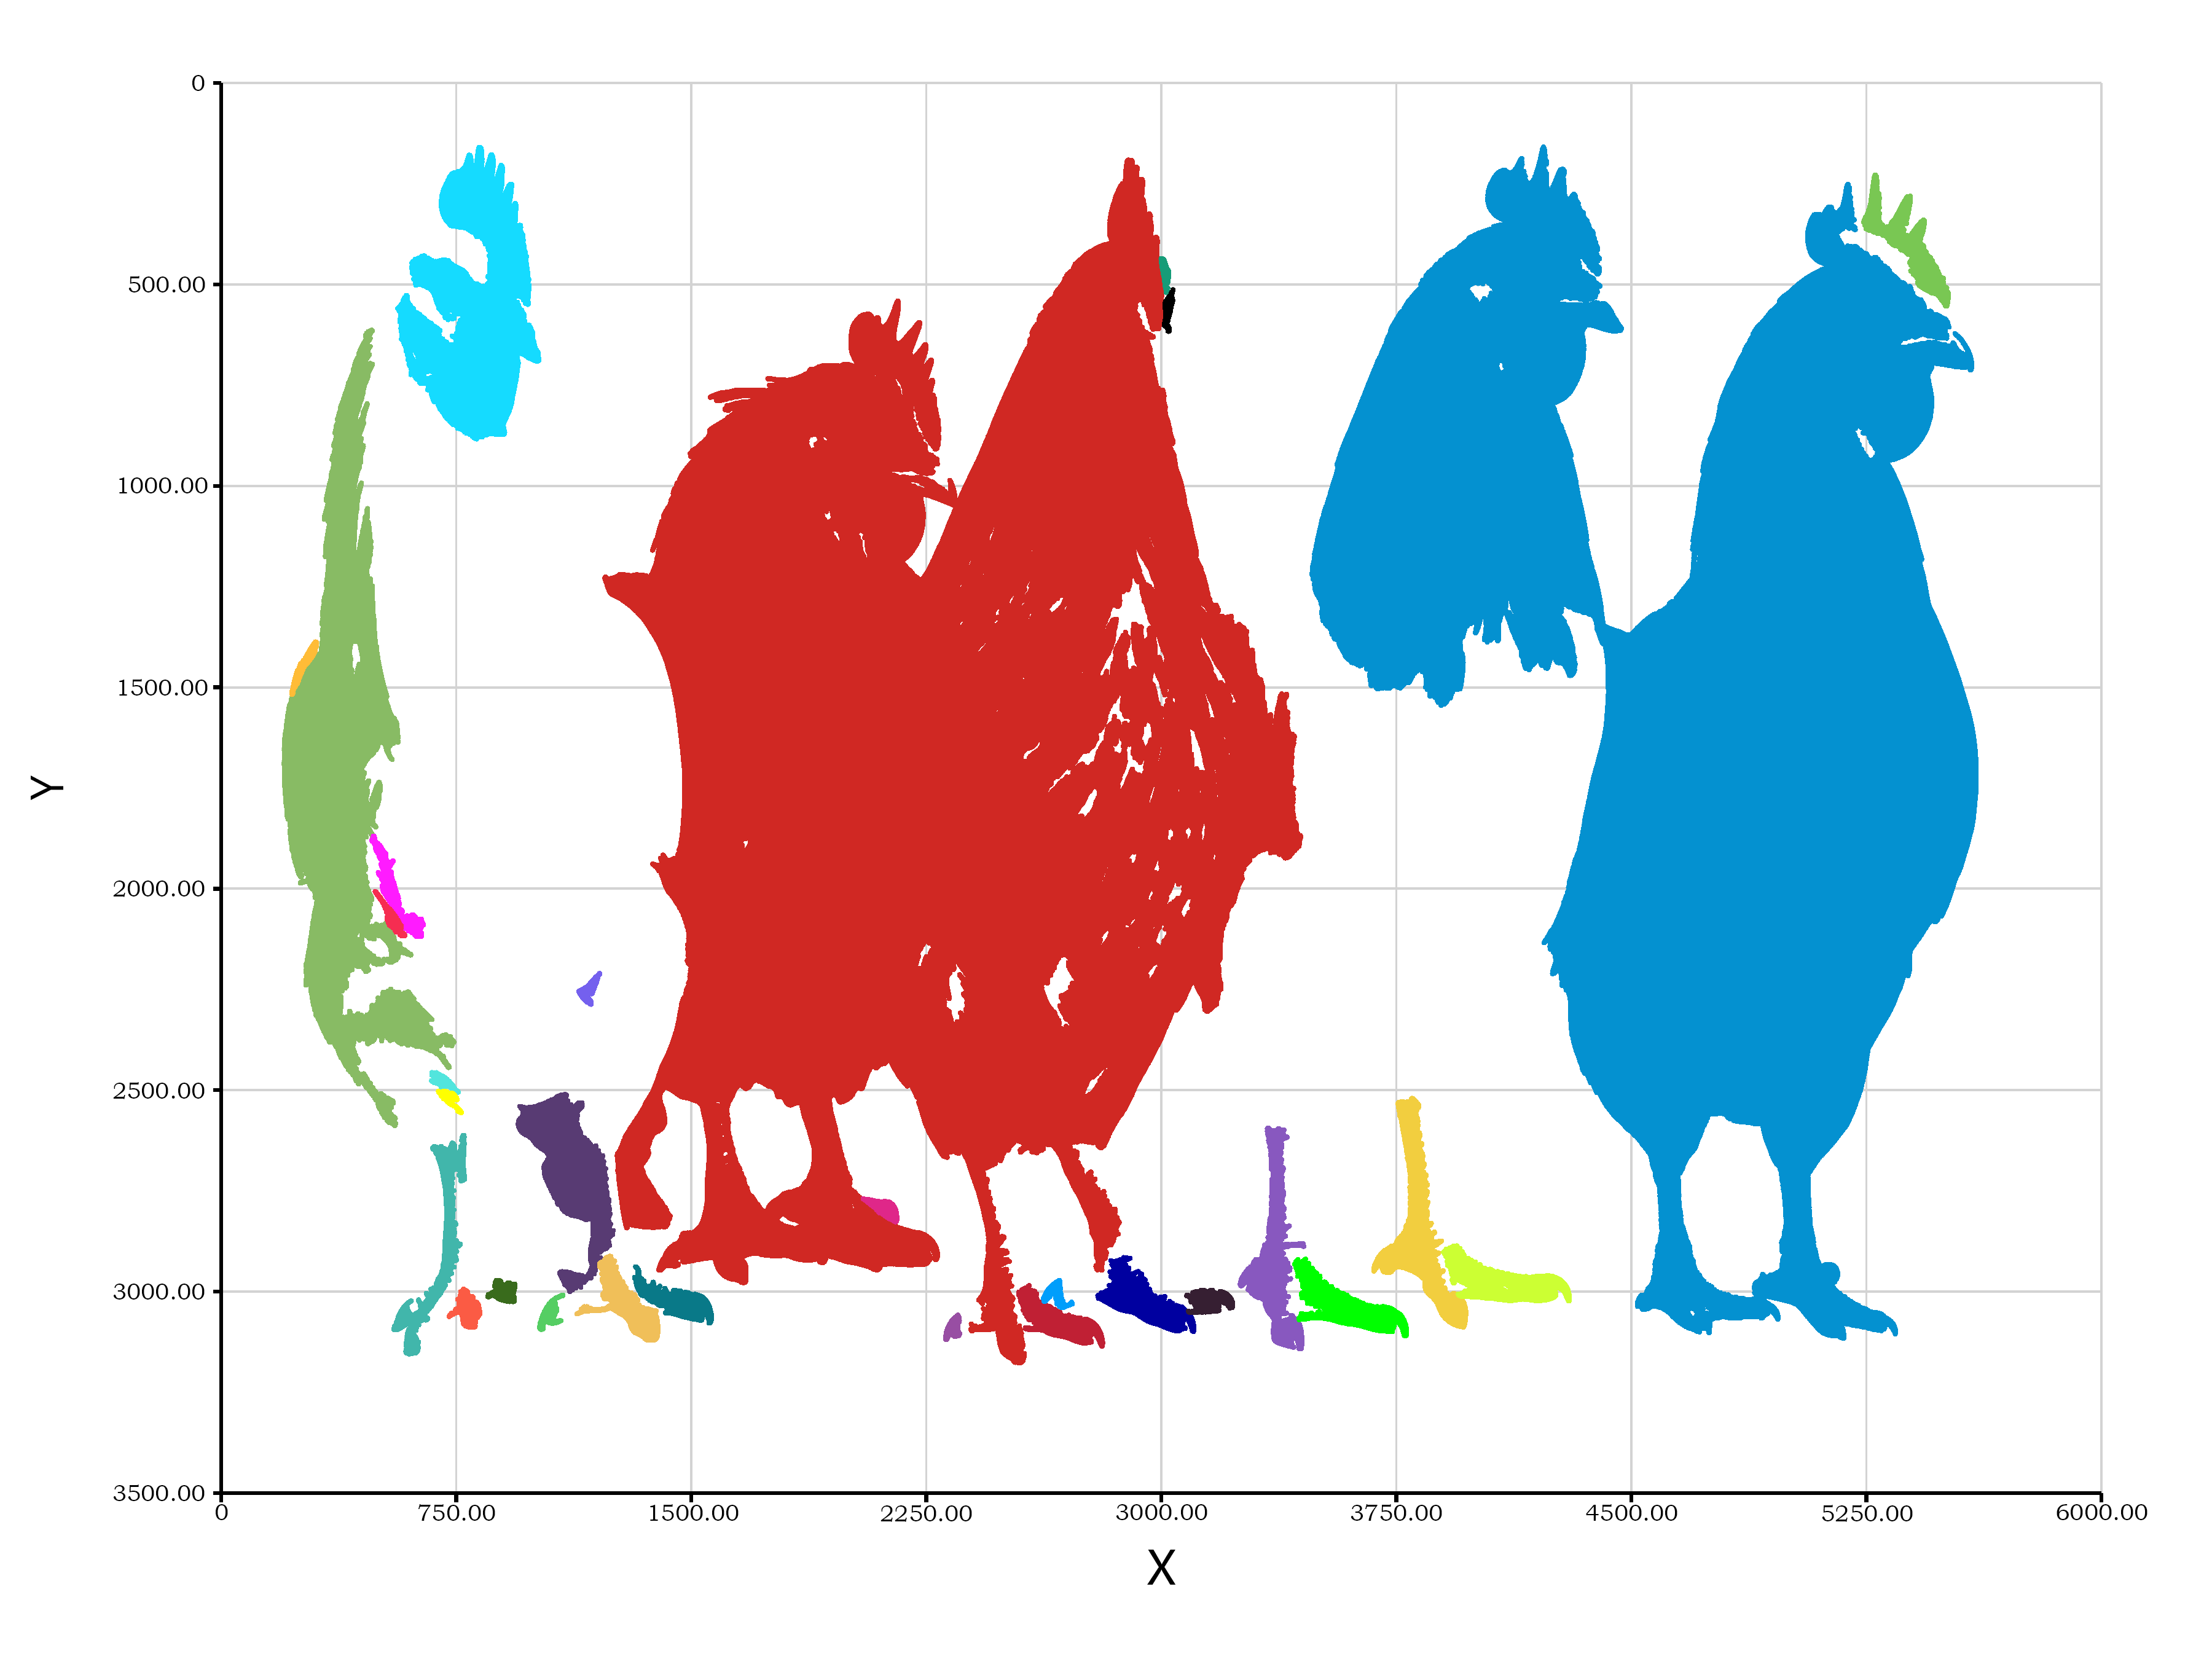
let shapes = machineVision::ccl(bin);
print(`find ${length(shapes)} shapes.`);
bitmap(bin, file = "ostu_bin.bmp");
bitmap(file = "shapes.png", size = [3600, 2700]) {
plot(shapes, scatter = TRUE, padding = "padding: 5% 5% 10% 10%;");
}
高级数据科学家 at 苏州帕诺米克
Working on Engineered bacteria CAD design on its genome from scratch. Writing scientific computing software for Tianhe & Sunway TaihuLight supercomputer. Do scientific computing programming in R/R# language, he is also the programming language designer of the R# language on the .NET runtime.
Latest posts by 谢桂纲 (see all)
- 单细胞视角下的微生物基因组代谢酶嵌入分析 - 2026年2月25日
- 基因组代谢酶层级嵌入 - 2026年2月23日
- 基因组功能吉布斯LDA主题建模 - 2026年2月23日

6 Responses
Je pense que cet algorithme présente encore des limitations importantes. Par exemple, sur plusieurs poules présentes sur l’image originale, l’une d’elles, parce qu’elle a des plumes blanches, voit ces dernières devenir indiscernables du fond blanc après que l’image a été traitée par binarisation de l’algorithme. Cela signifie que les informations caractéristiques de ces plumes ont directement disparu de l’image. C’est la raison pour laquelle, après identification, le corps de la première et de la troisième poule sur l’image apparaît dans un état fragmenté. Si nous pouvions modifier cet algorithme pour qu’il effectue l’analyse et l’identification via une image en niveaux de gris plutôt qu’une image binaire noire et blanche, je pense que les résultats seraient bien meilleurs.
I would like to gain a more detailed understanding of the computational principles behind this algorithm. Could you please provide a more in-depth explanation specifically on this topic?
有两只挨着的母鸡在二值化之后就分不开了
CCL算法没法处理这种连接的对象有这个缺点
This algorithm cannot help me count how many hens there are in the picture.
The algorithm failed to achieve the expected results, primarily because the color details of some hens were not preserved in the binarized image, lacking sufficient information to distinguish them.